Status Tab
Navigation
- Click Devices on the left navigation bar.
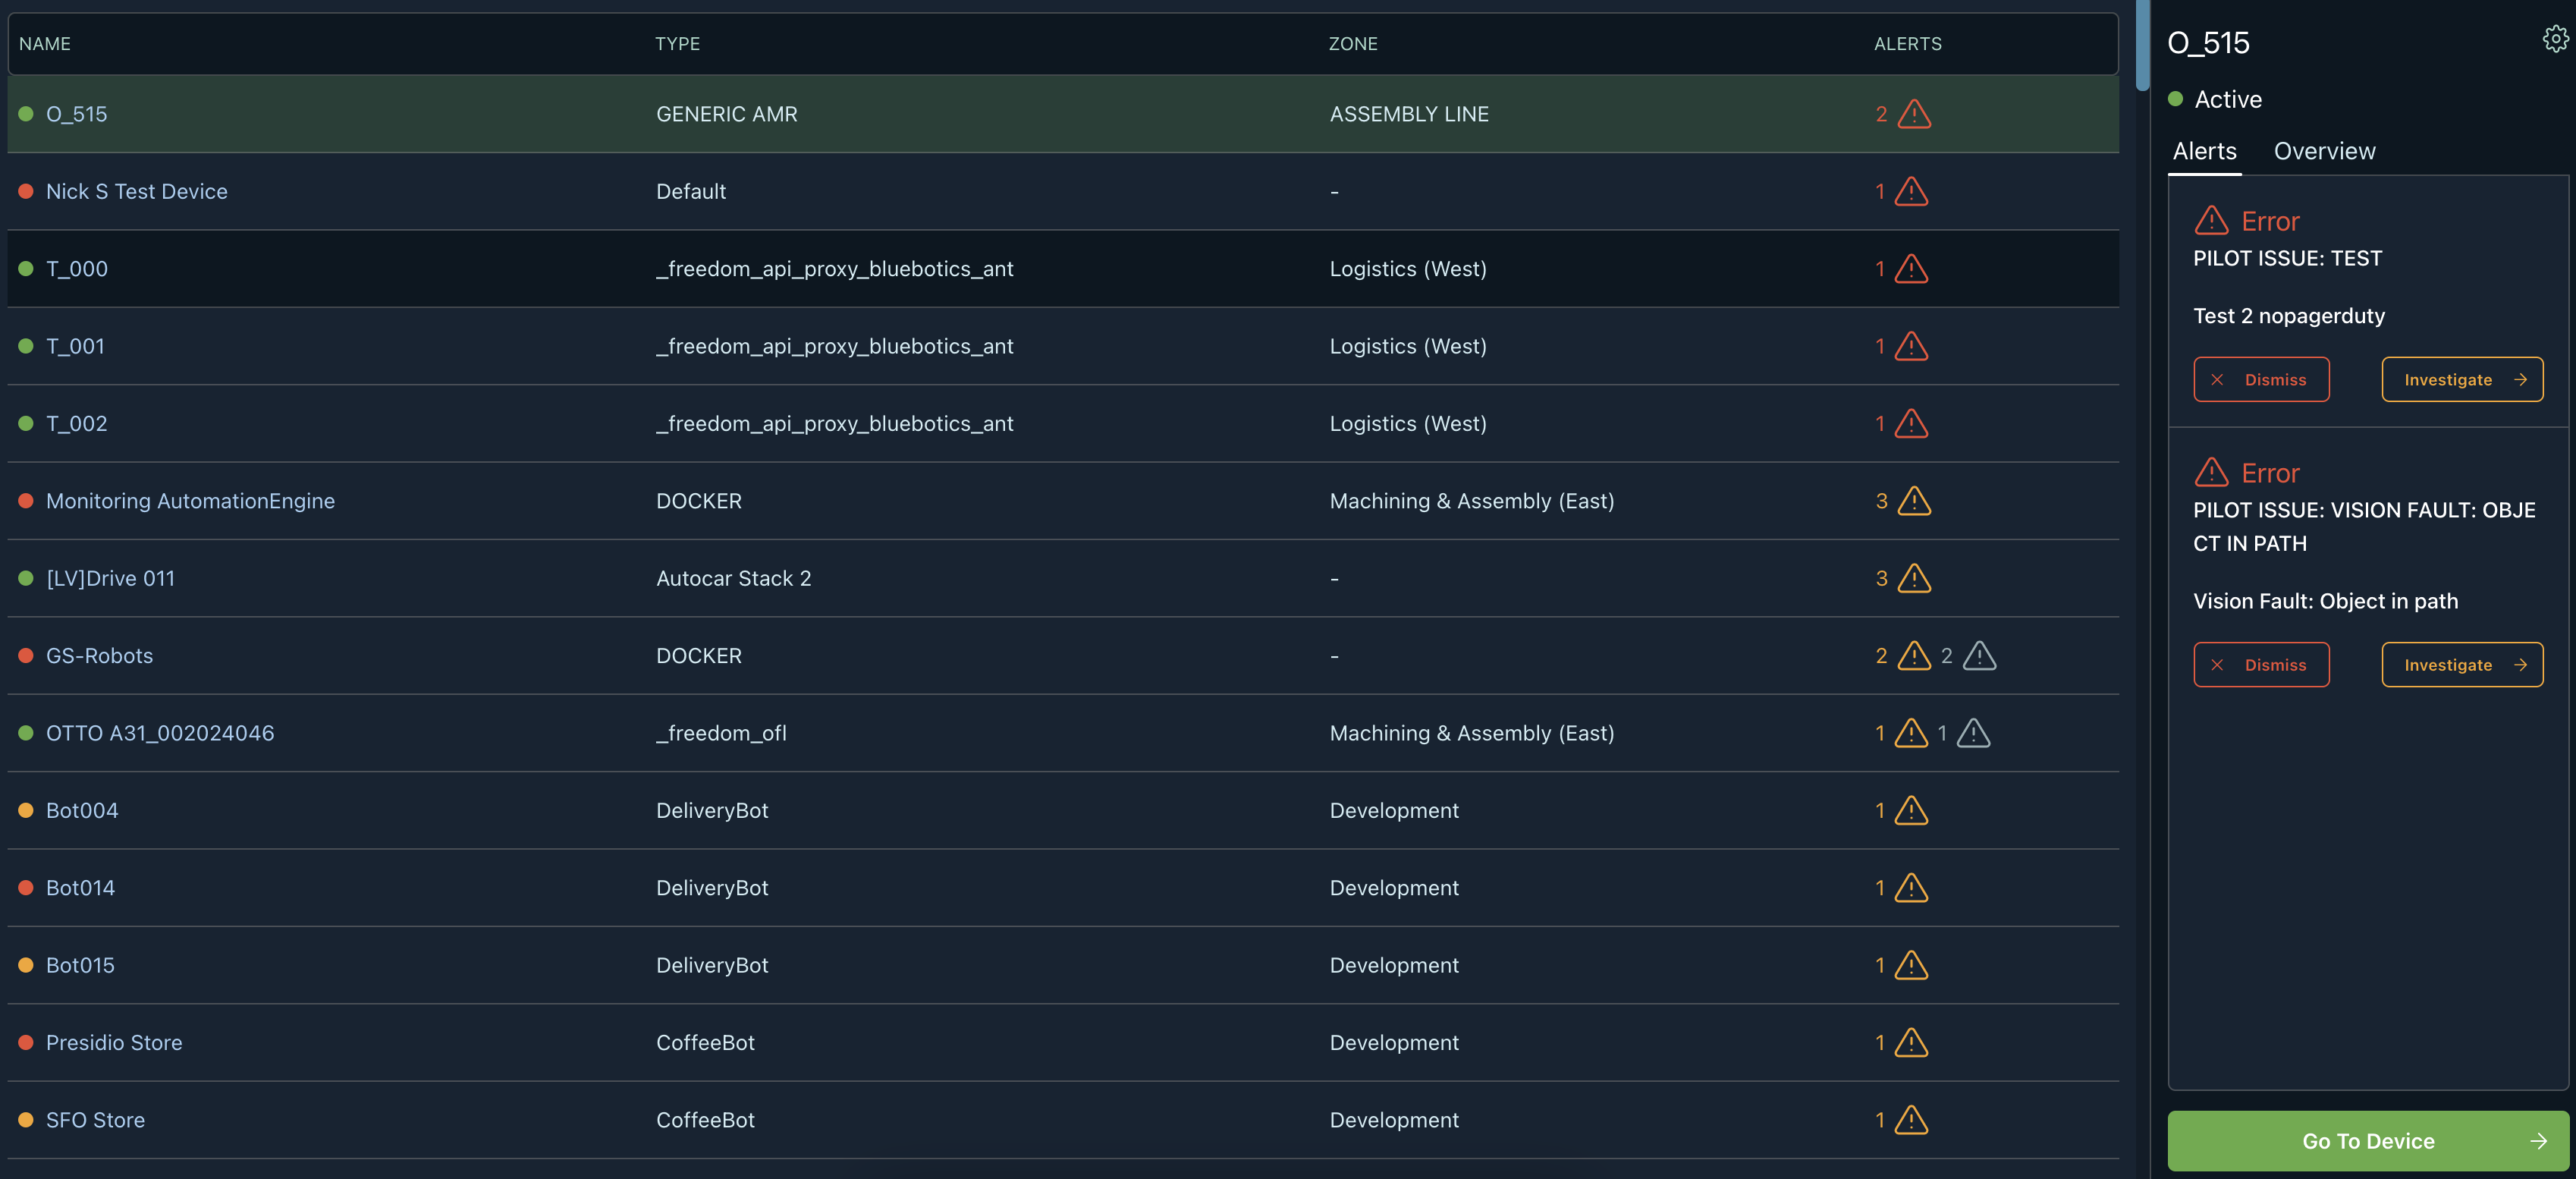
- Navigate to a device by clicking Go To Device or clicking the name in the table row.
- Click Status.
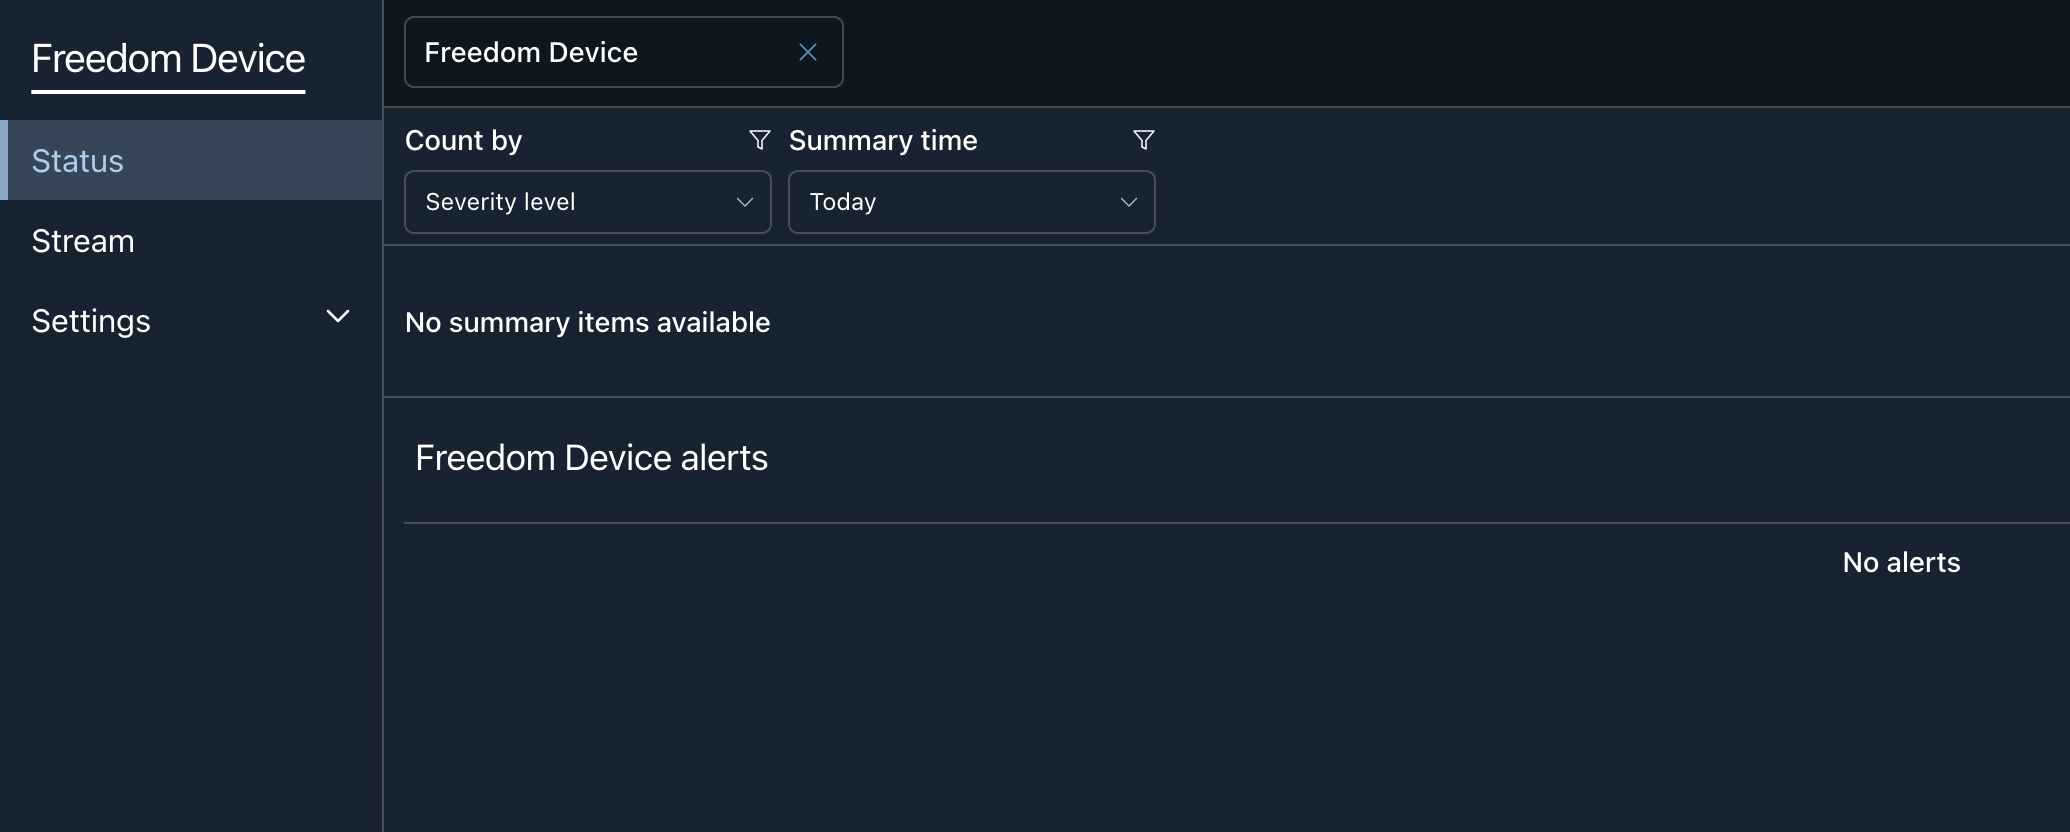
- You will be taken to the status view of the device.
Overview
The Status page for your device will allow you to see trends of alerts and active/resolved alerts. From this page, you can easily pivot to reviewing other devices with the Device Name Input. There are multiple device filters to organize alerts by severity level, name, or description.
Let's dive into each input field!
Device Name
The first input on the top left is the name of the device:

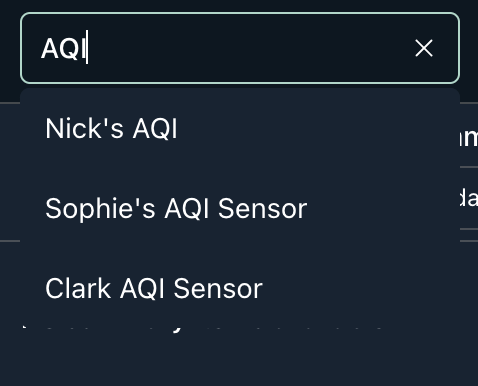
It is editable, and by clearing out the input, you have the ability to search for another device. Once the desired device is found, you can click on it to load its status page. For example,
Device Filters
Beneath the name input are 2 filters. These filters are:
| Count By | This select input controls the x-axis label. Currently you can have alerts returns by severity level, name, or description |
| Summary Time | Defines the time range when alerts are returned |

An example table row has from left to right:

| Level | The level of the error (info, warn, error, fatal) |
| Name | A word or set of words describing the alert |
| Created At | The timestamp in local military time when the alert triggered. By clicking on this timestamp, it will navigate you to the Stream Dashboard when the alert occurred. You can then review the dashboard to understand what your device was doing around that time to throw that error. |
| Resolved At | The timestamp in local military time when the alert resolved. |
| Action Button to Resolve | Enabled - Action Button will prompt for a reason why it is being resolved manually Disabled - Alert has resolved either manually or automatically |
| Action Button to go to Alert | Will navigate you to the status page for that alert to see more details |
Updated about 4 years ago
