System Tab
Understanding your robot's resource usage
Time to complete: 10 minutes
The system tab provides both a real-time and historical view of your robot's resource consumption, including CPU, memory, disk, and bandwidth usage. This information is key to understanding your robot's performance and diagnosing problems when something goes wrong. For example, you could:
- Compare your robot's resource usage in the lab versus real-world environments to validate your system design
- Detect and resolve memory leaks by identifying processes with increasing memory usage over time
- Measure best- and worst-case bandwidth usage and identify connectivity dead zones
To get started, we'll walk through each of the following components of the stream page:
- Resources
- GPU
- Processes
- Topic Bandwidth
- Topics
- Network
- Historical Data and Sharelinks
Resources
The resources panel provides a window into your robot's CPU, memory, and disk usage, as well as the CPU temperature. System resource usage values at or close to 100% or temperatures exceeding the recommended value for your CPU are likely to impair your robot's performance. We've included suggestions on best practices here (ADD LINK TO BLOG POST).
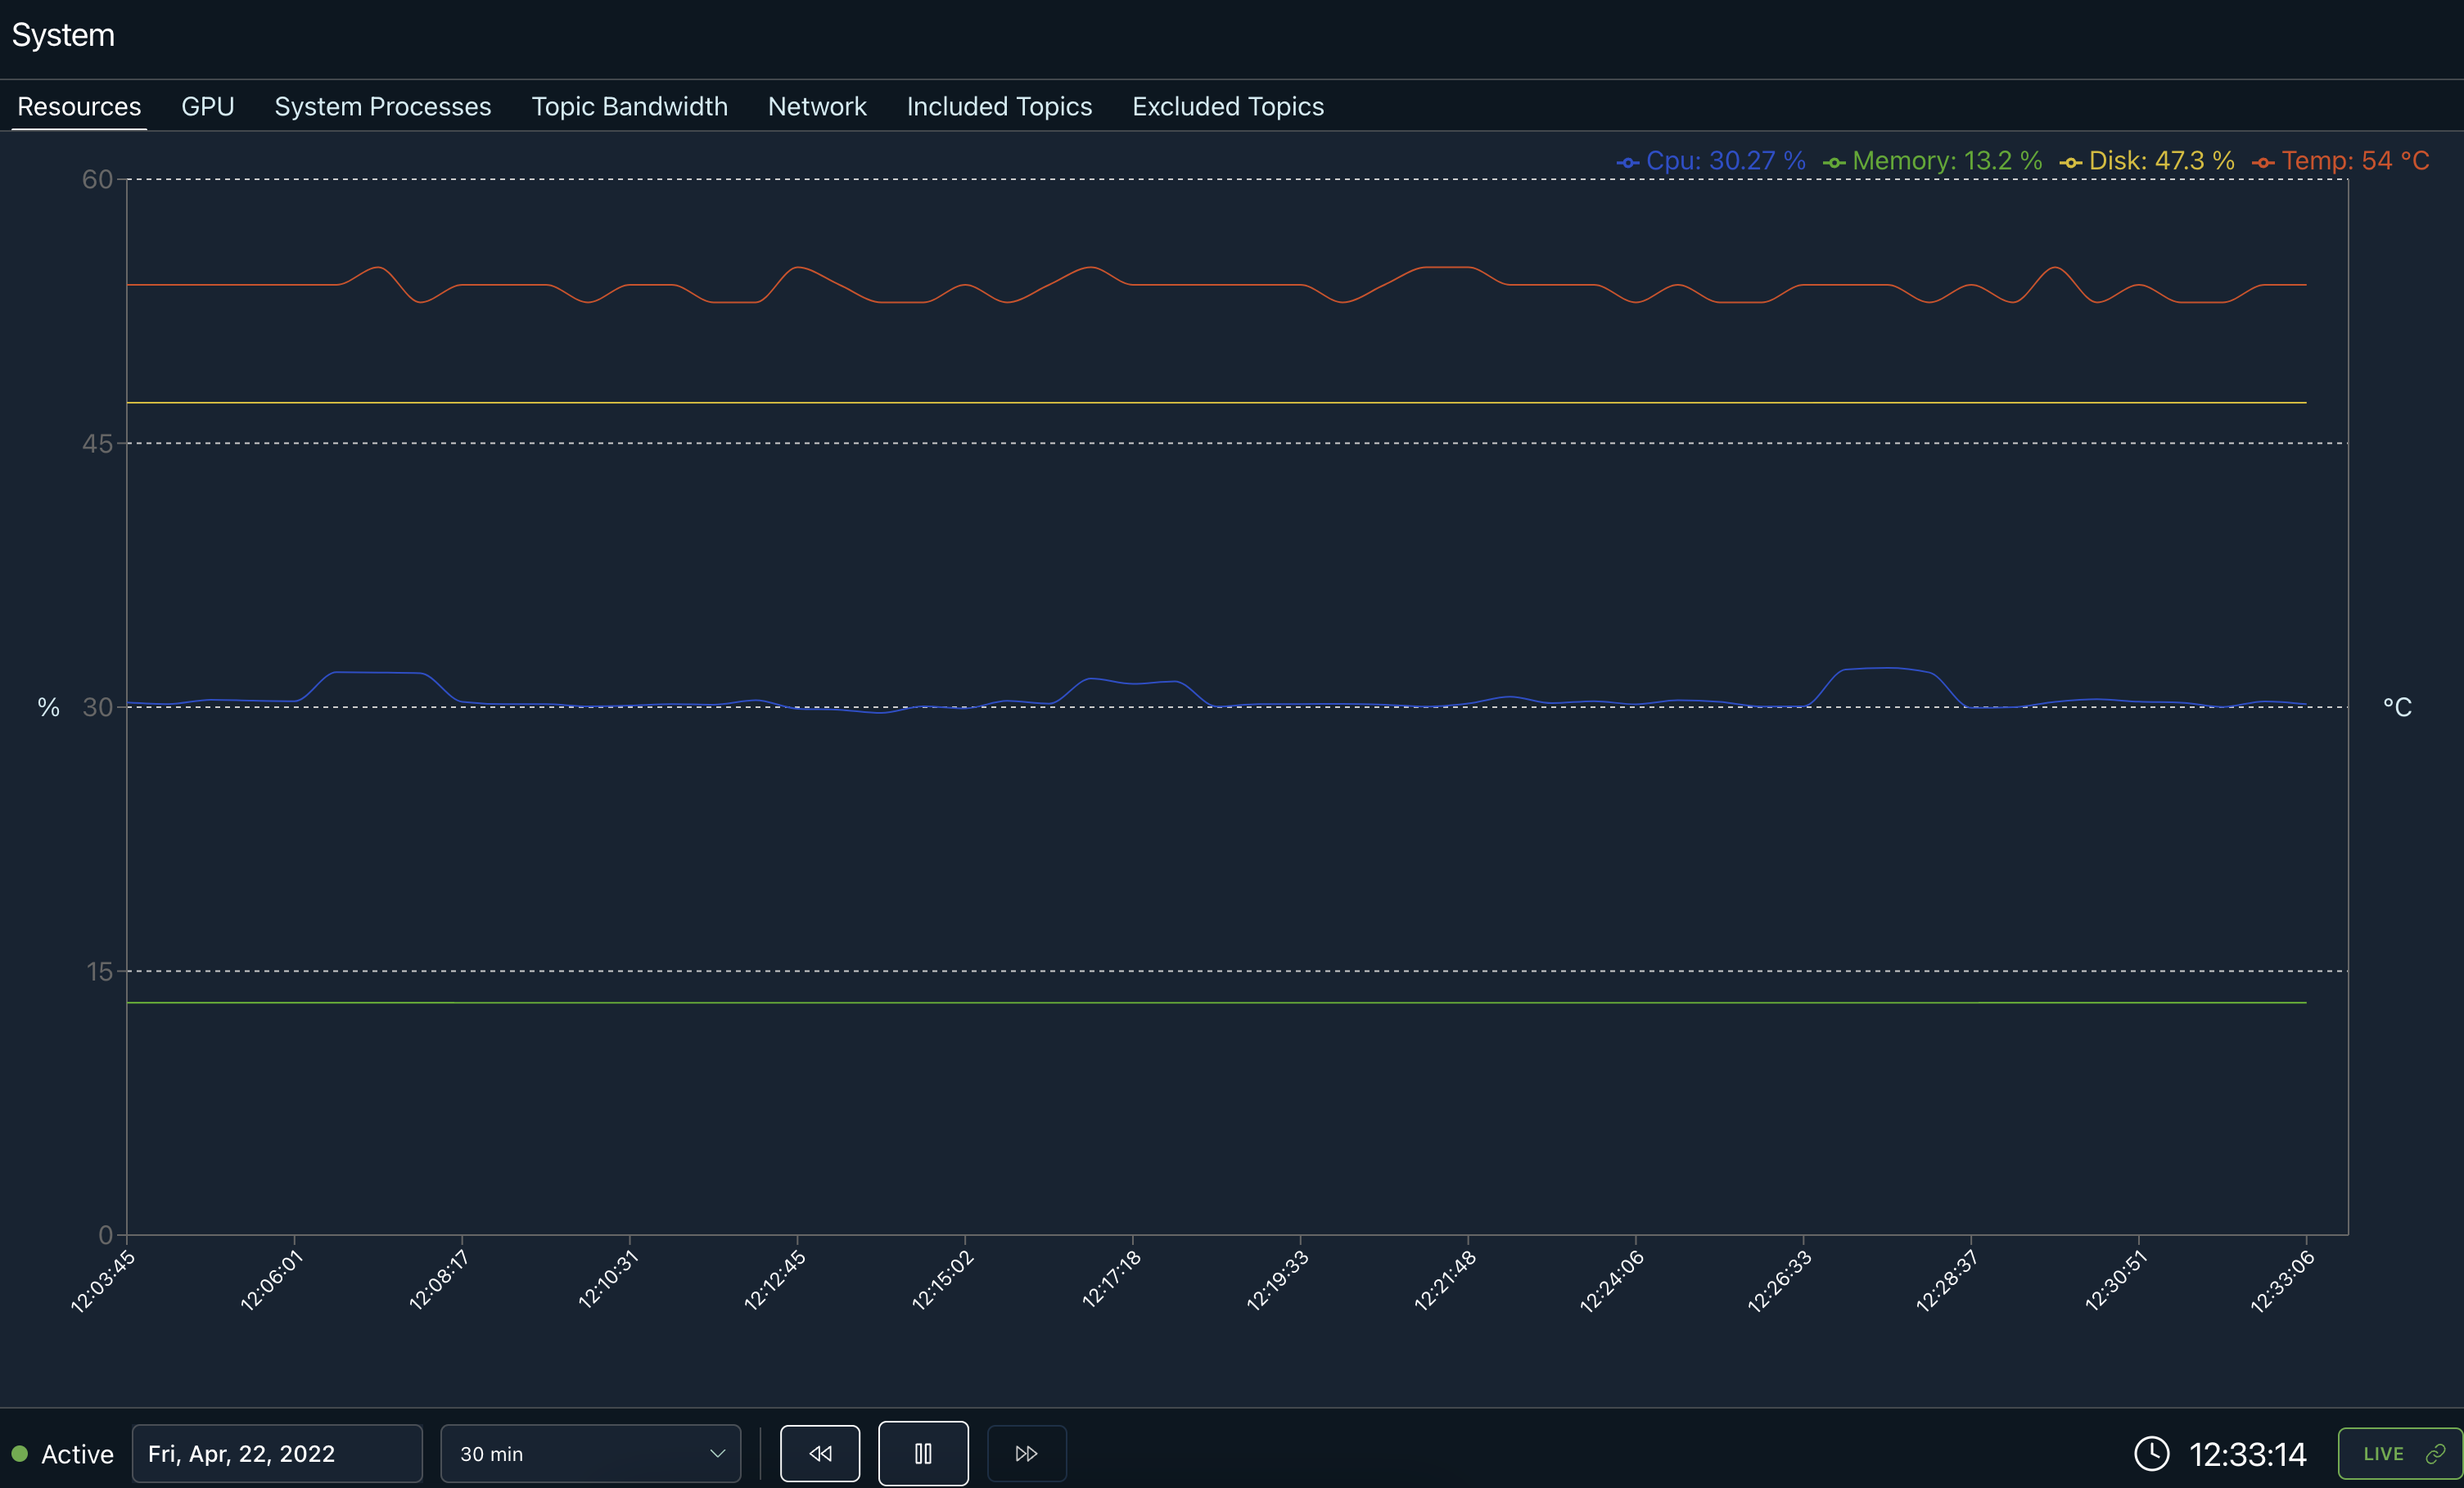
Visualize CPU, memory, disk usage and CPU temperature over time to spot anomalies and debug issues.
GPU
The GPU panel provides a real-time view of your robot's GPU usage and temperature. GPU usage is often easier to predict than CPU usage because the GPU is used for specific computationally demanding tasks rather than general computation. You can therefore push your GPU close to its limits, but it's still important to ensure that usage doesn't hit 100% and the maximum temperature is not exceeded to avoid performance issues.
Processes
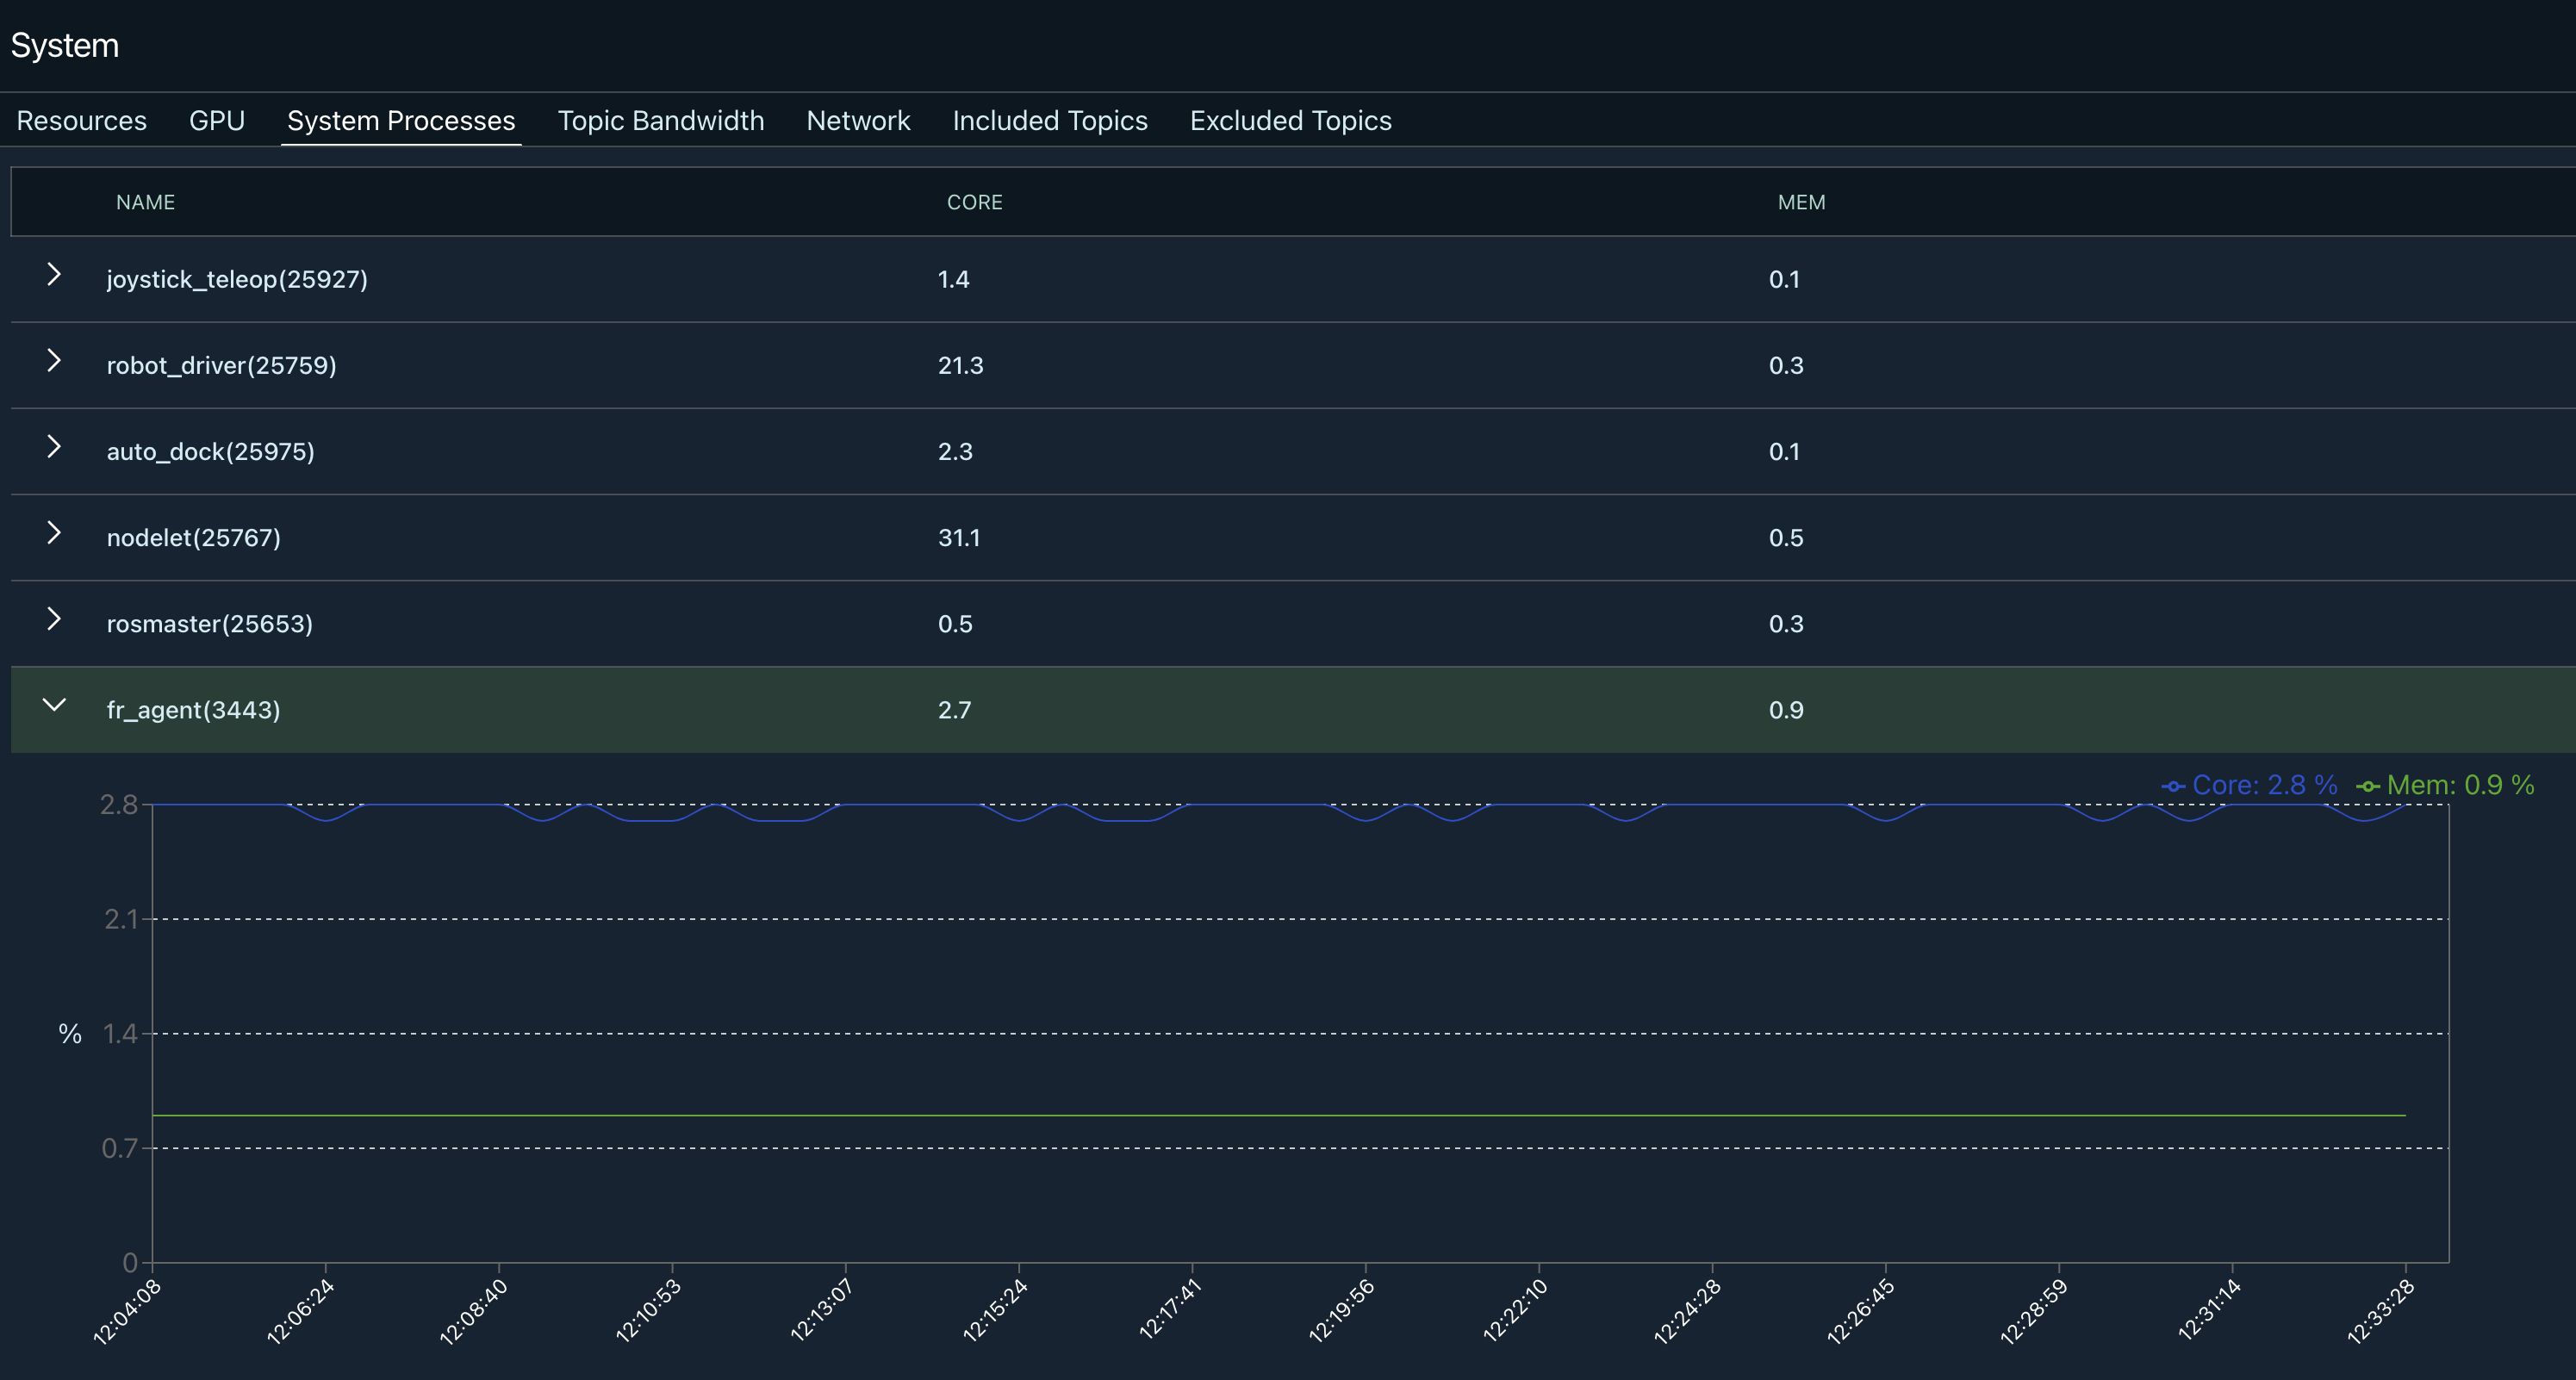
The processes panel displays the percentage of core and memory usage for each process currently running on your robot. Clicking on the name of a process opens a graph plotting usage over time. This allows you to quickly determine the computational load of different processes and identify issues like increasing memory consumption over time that may indicate a memory leak.
Topic Bandwidth
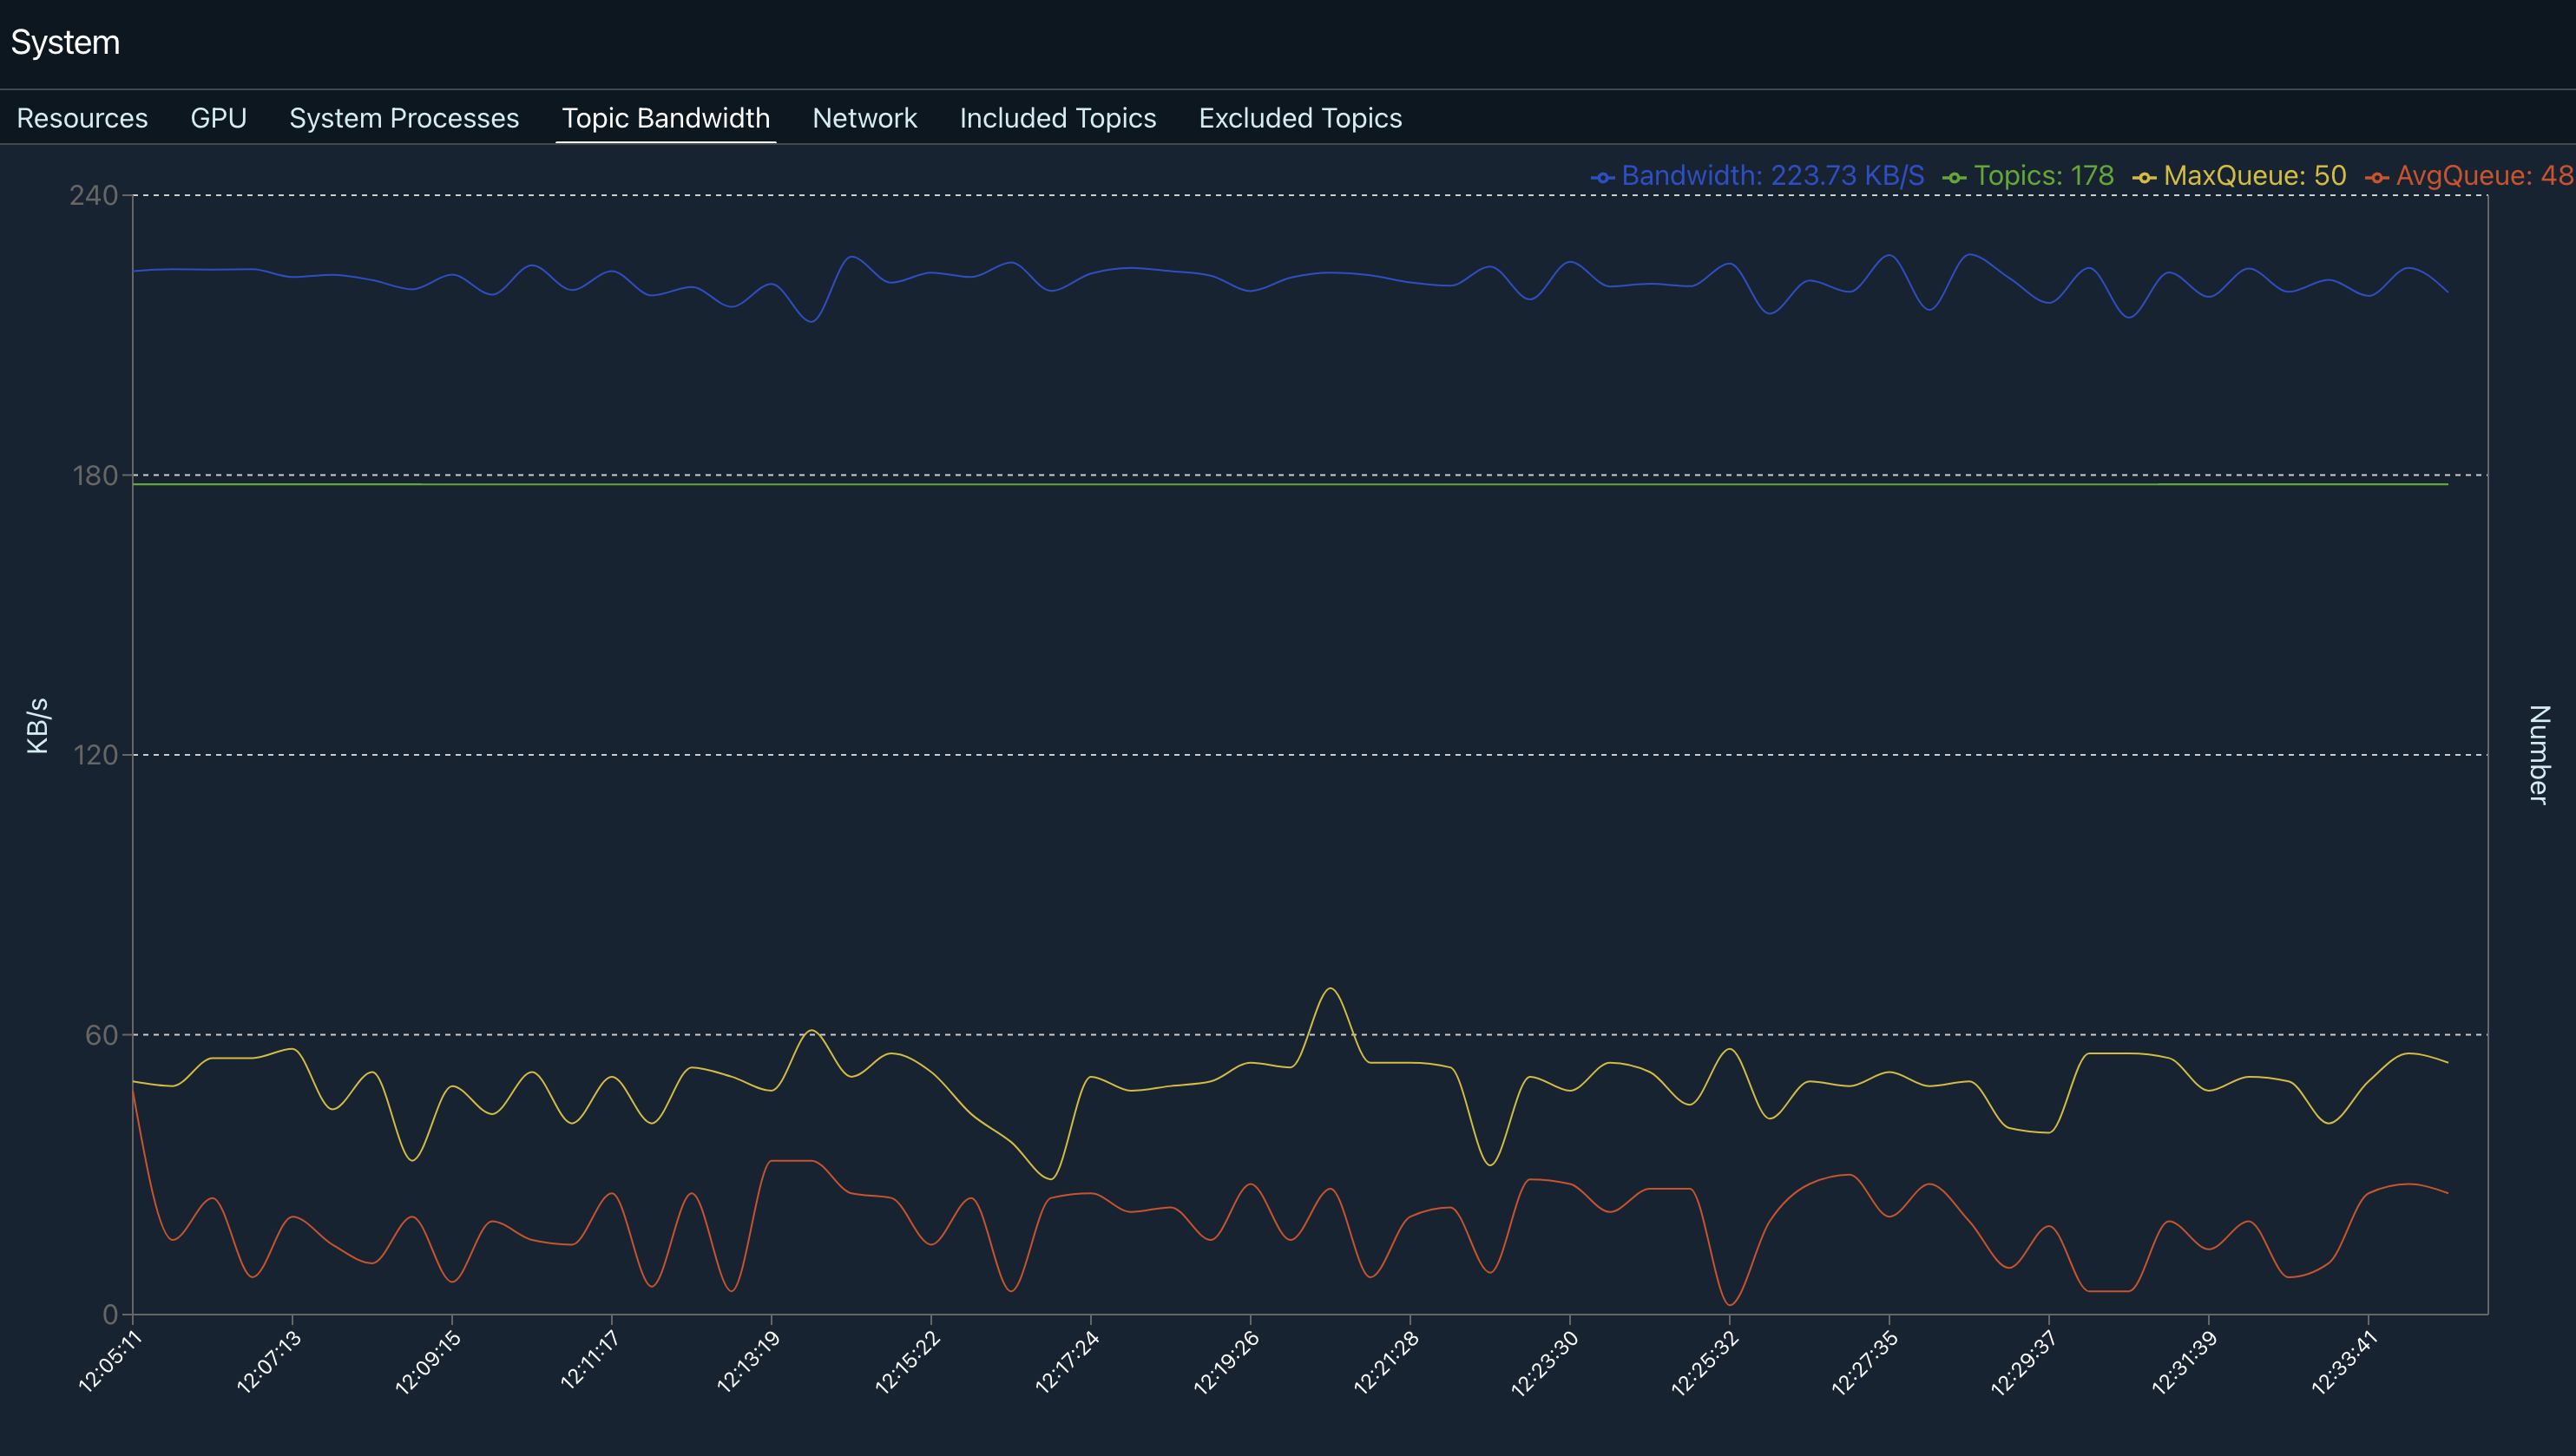
The topic bandwidth panel gives insight into your robot's topics, including the total bandwidth, the number of topics, and the maximum and average queue. It's important to ensure that the queue remains stable and doesn't begin to increase over time, which could indicate system resource constraints. If the message queue length is consistently increasing, you'll need to exclude topics or decrease their upload frequency until the available bandwidth can support the amount of data being uploaded. (WHAT DOES THE BANDWIDTH ACTUALLY MEAN - VS BANDWIDTH OF UPLOAD TO FREEDOM)
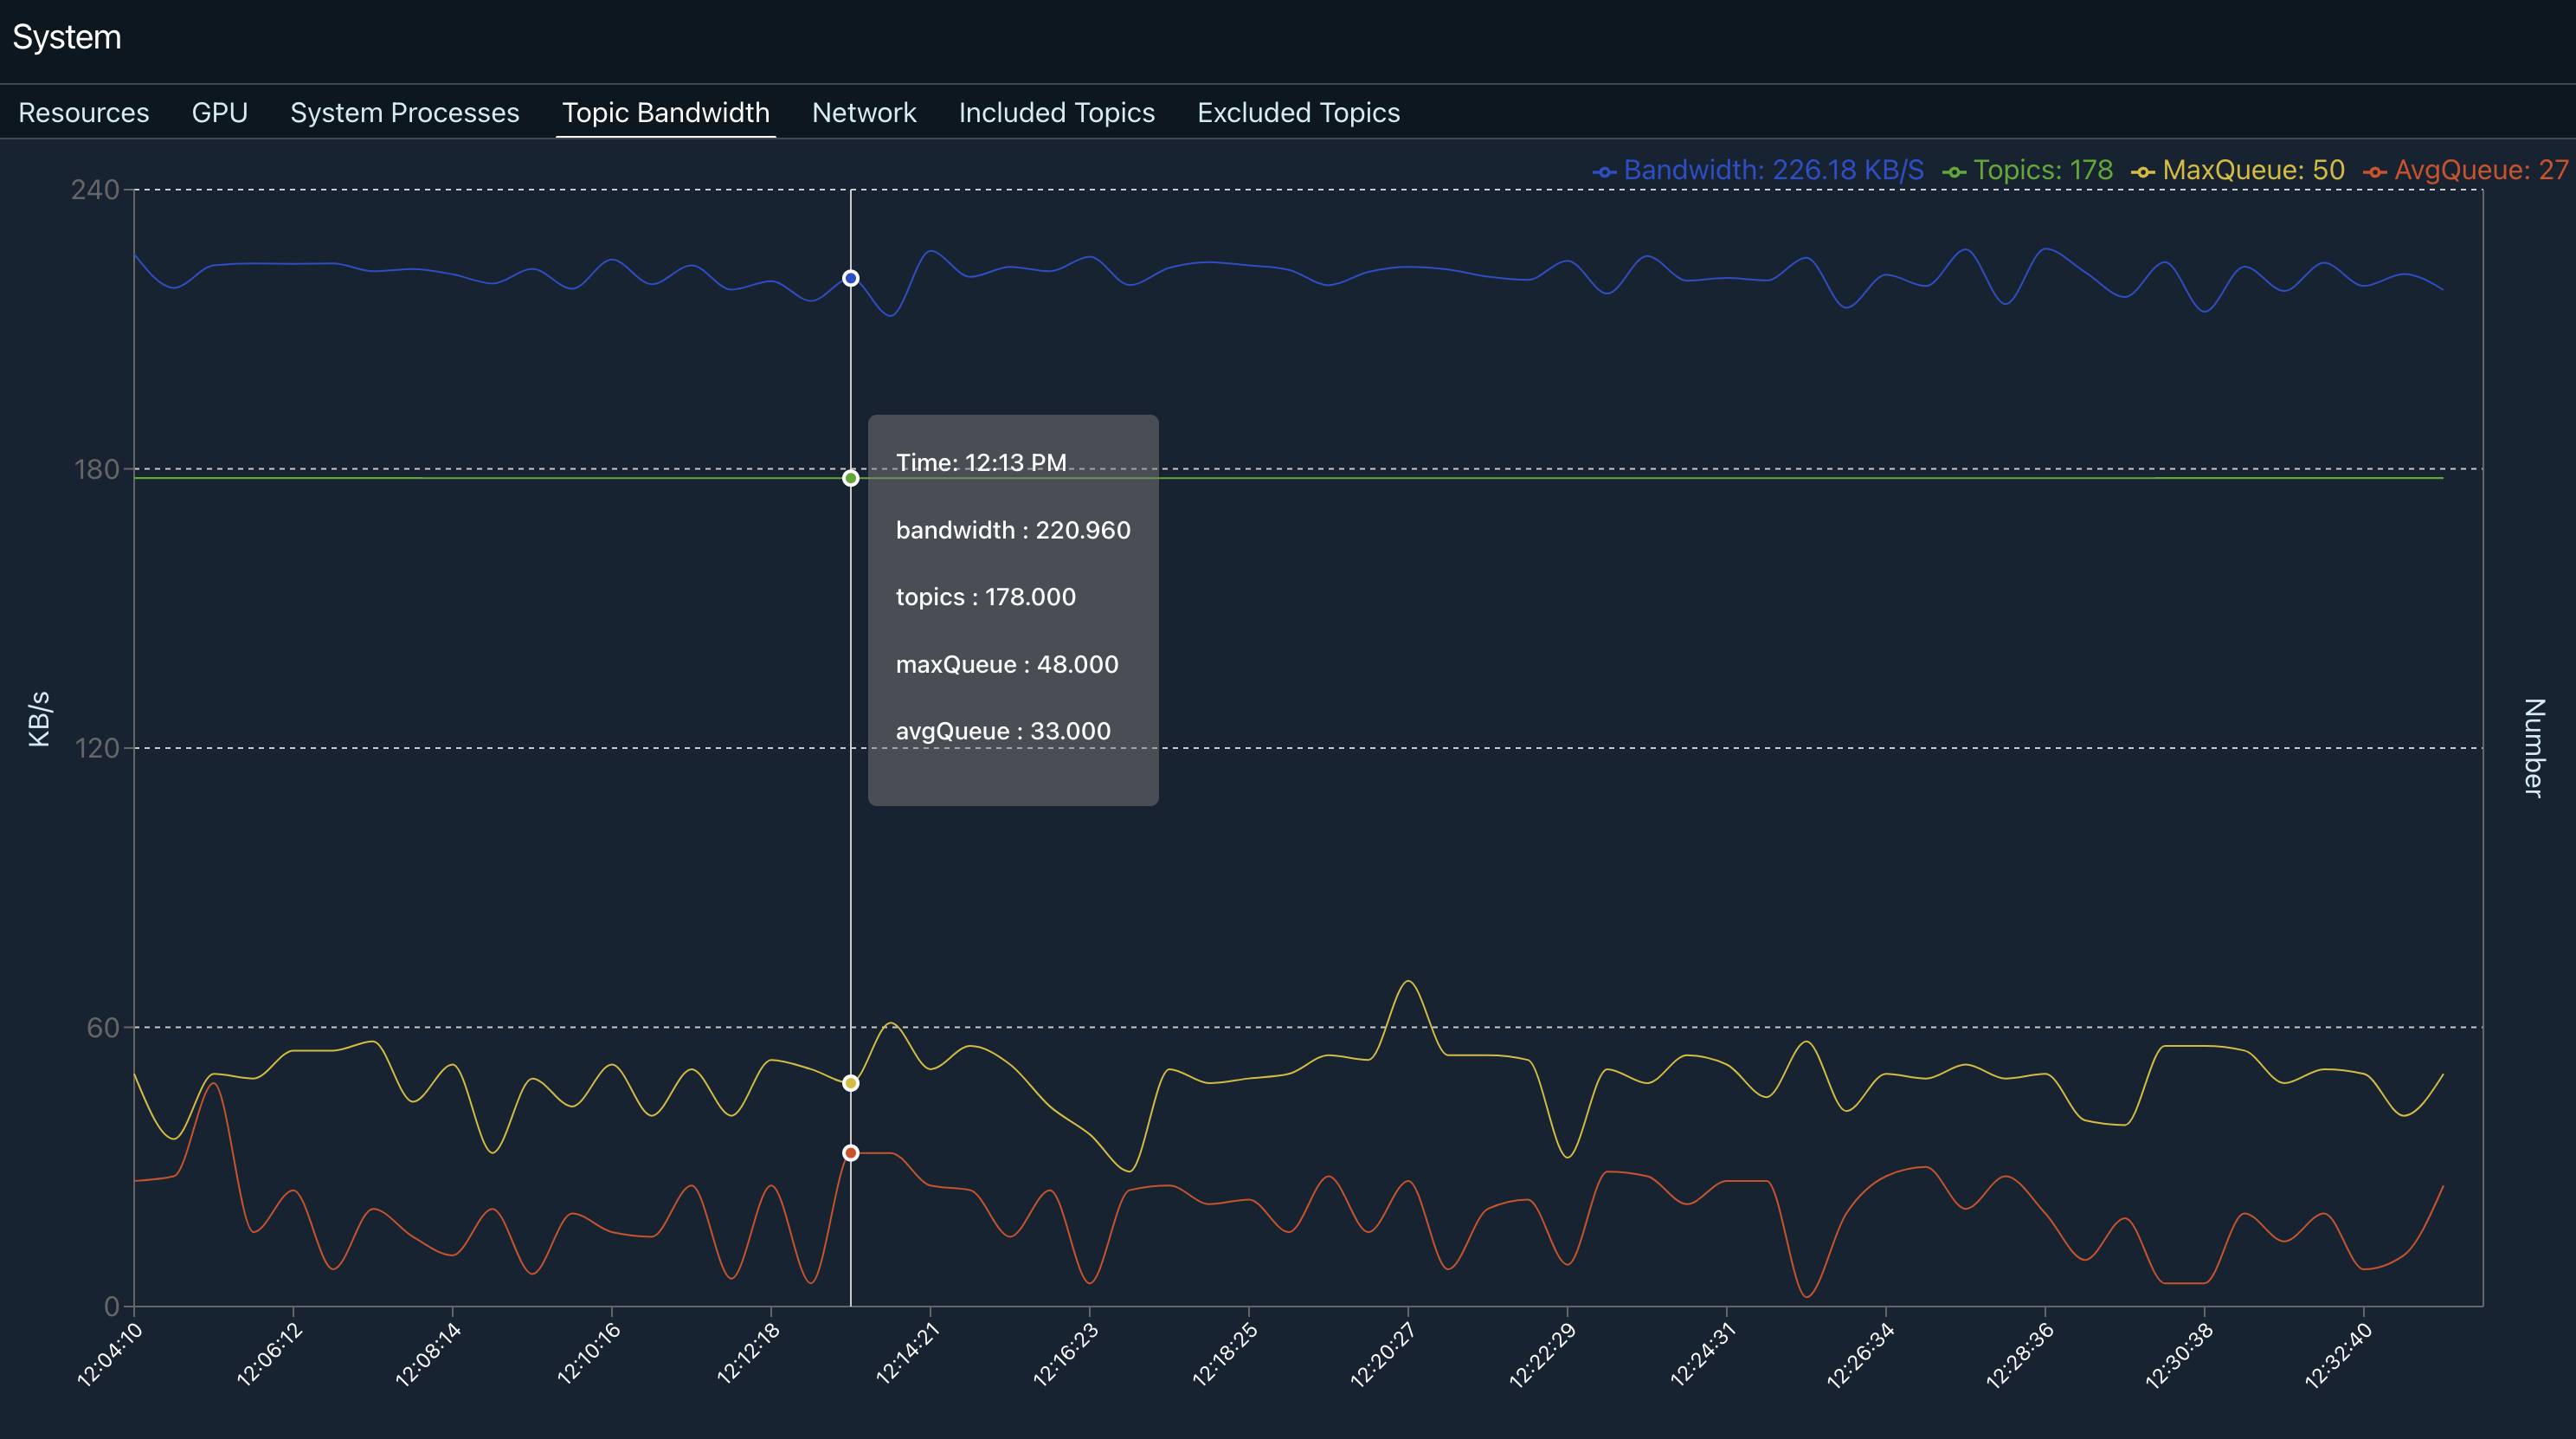
The topic bandwidth panel allows you to understand your robot's bandwidth and queue length over time.
Topics
The topics panel provides a comprehensive list of all of your robot's topics (IS THIS CORRECT, OR IS IT ONLY TOPICS BEING UPLOADED IN FREEDOM?), along with the message type, frequency, upload frequency, and message size. This is an excellent place to start when you want to understand which topics are being uploaded to Freedom and at what frequency when tuning your bandwidth usage. Click on a topic to see a graph of the message size, frequency, and upload frequency over time.
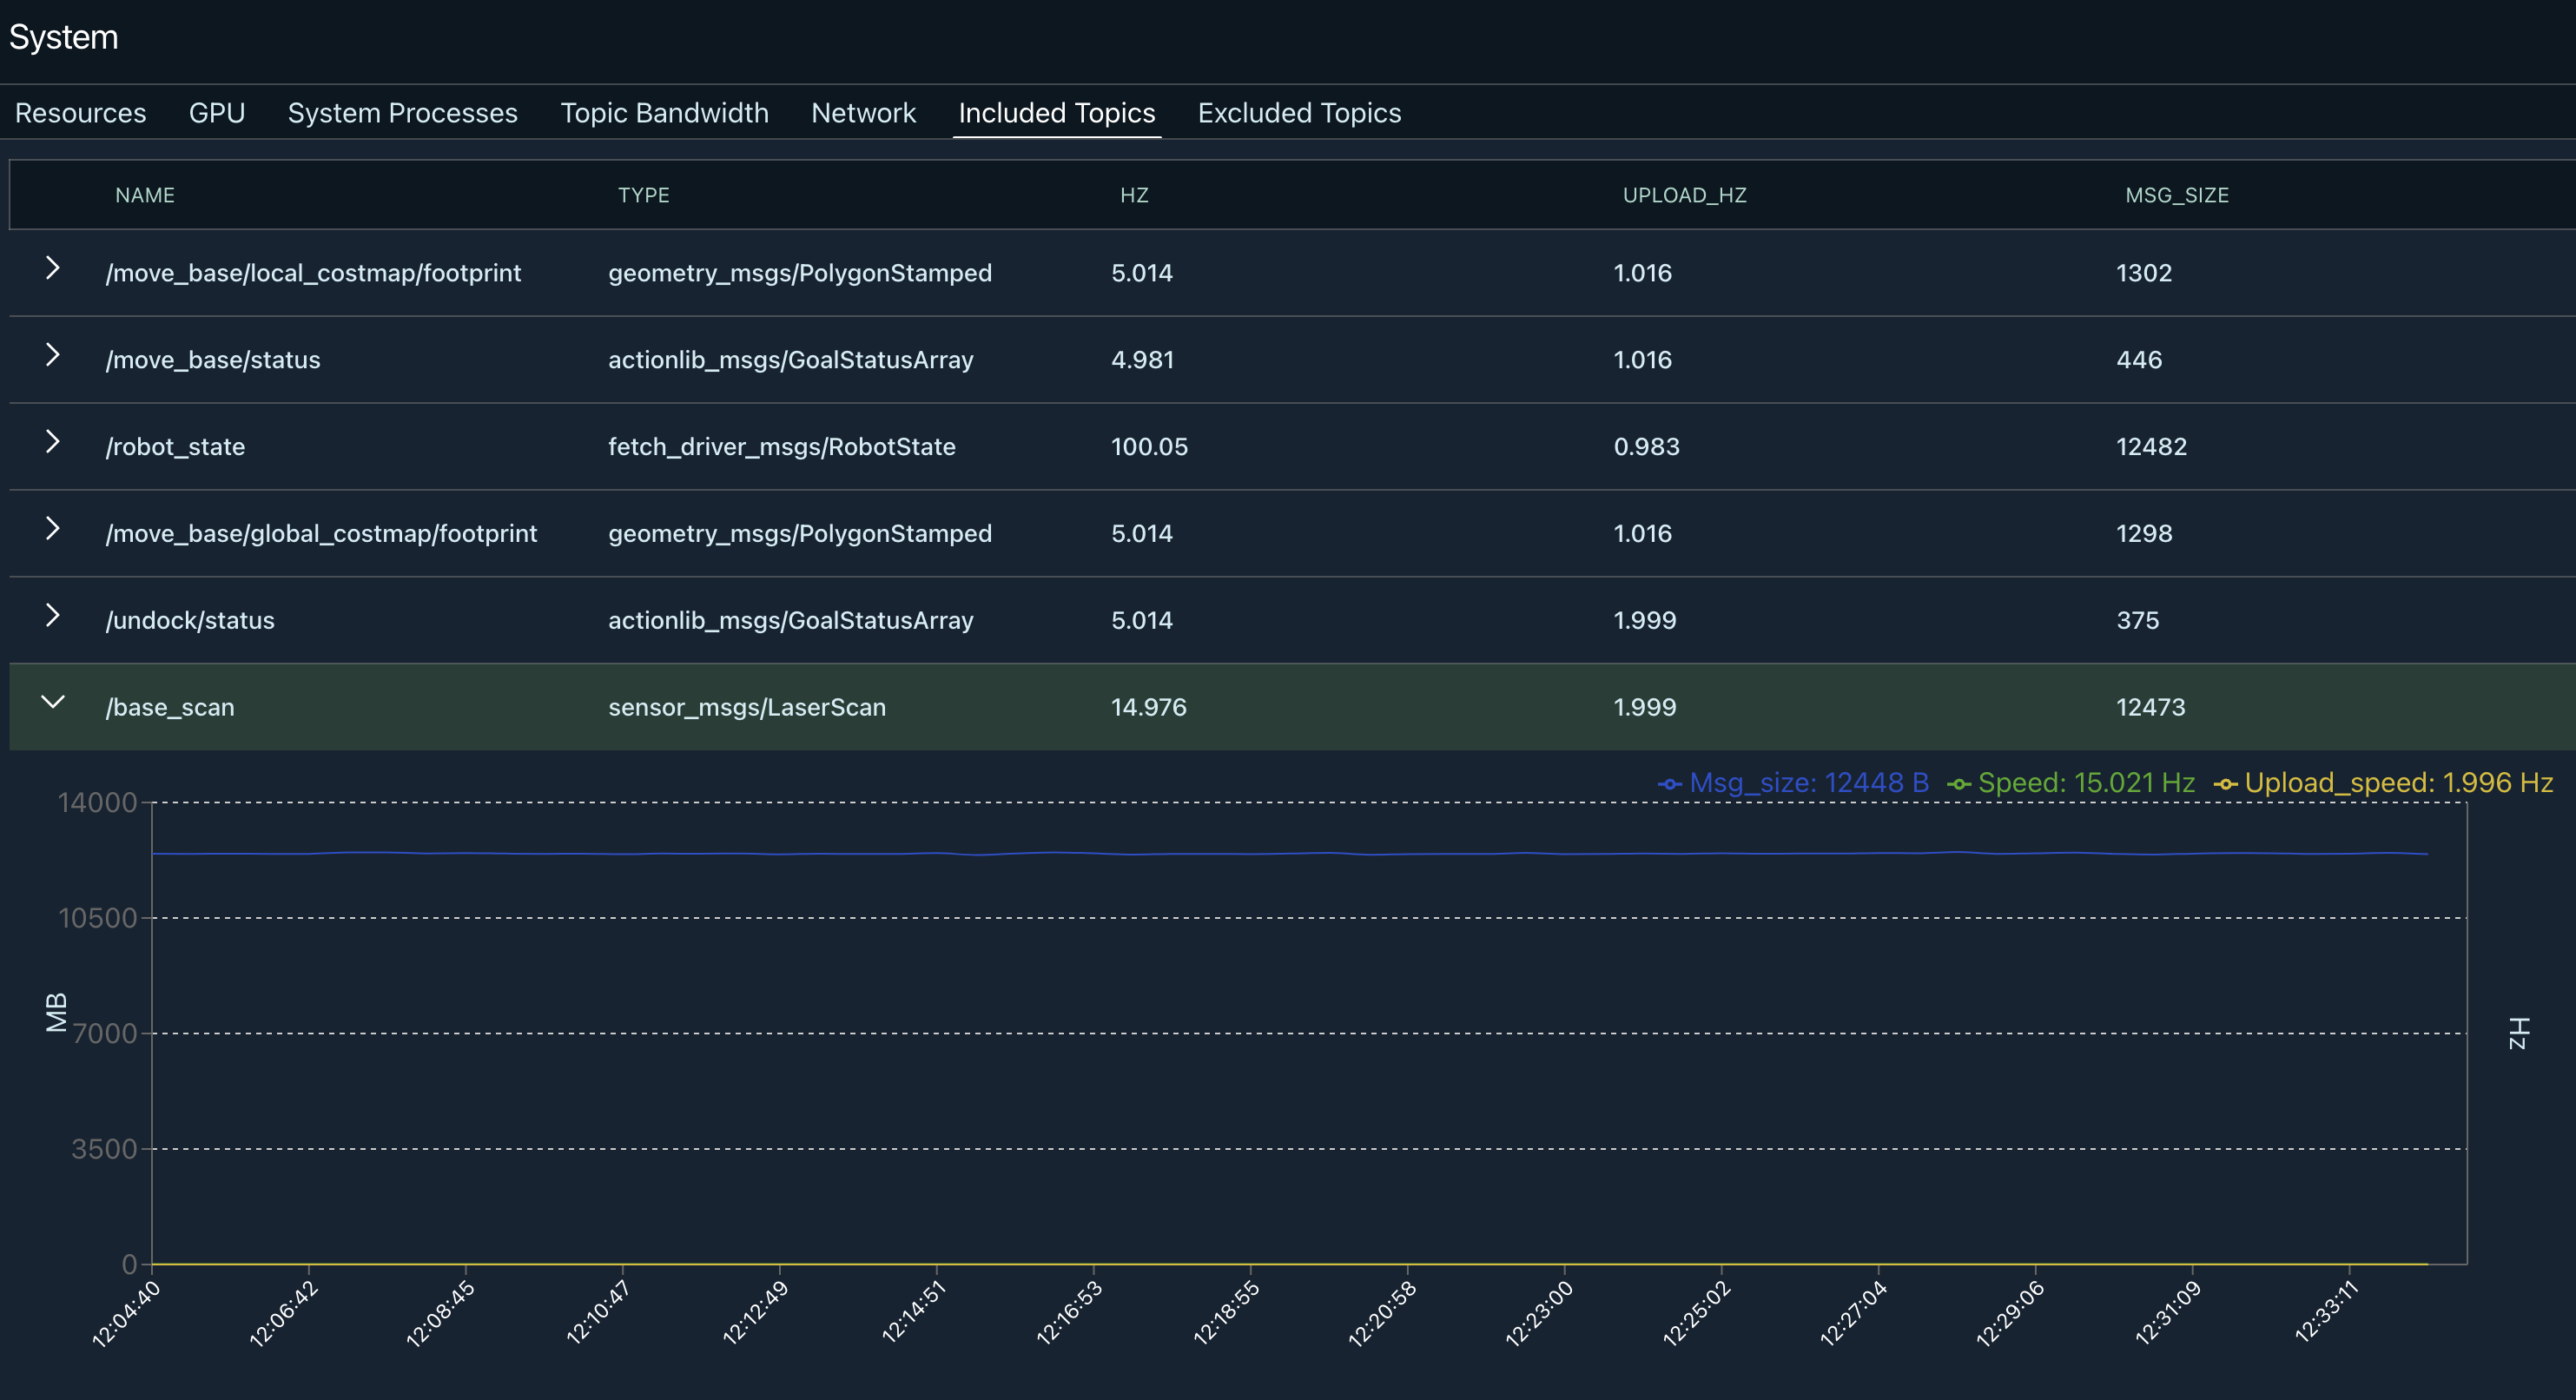
Clicking on a topic shows a plot of the message size, frequency, and upload frequency over time.
Network
Connectivity is key for reliable monitoring and control of your robot in the field. The network panel provides a window into network usage and connection quality over time.
If your robot uses or switches between different network connections (e.g. WiFi vs. cellular), you can use the dropdown menu in the top right corner to select the connection data you would like to view.
Connection and Signal Quality
The first panel displays the connection and signal quality for wireless connections. Here, you can determine when the signal was lost or its quality was degraded and cross-reference them with the robot's position at that time to identify connectivity dead zones.
Monitor your robot's connection quality and signal level over time to diagnose network issues.
Bandwidth Consumption
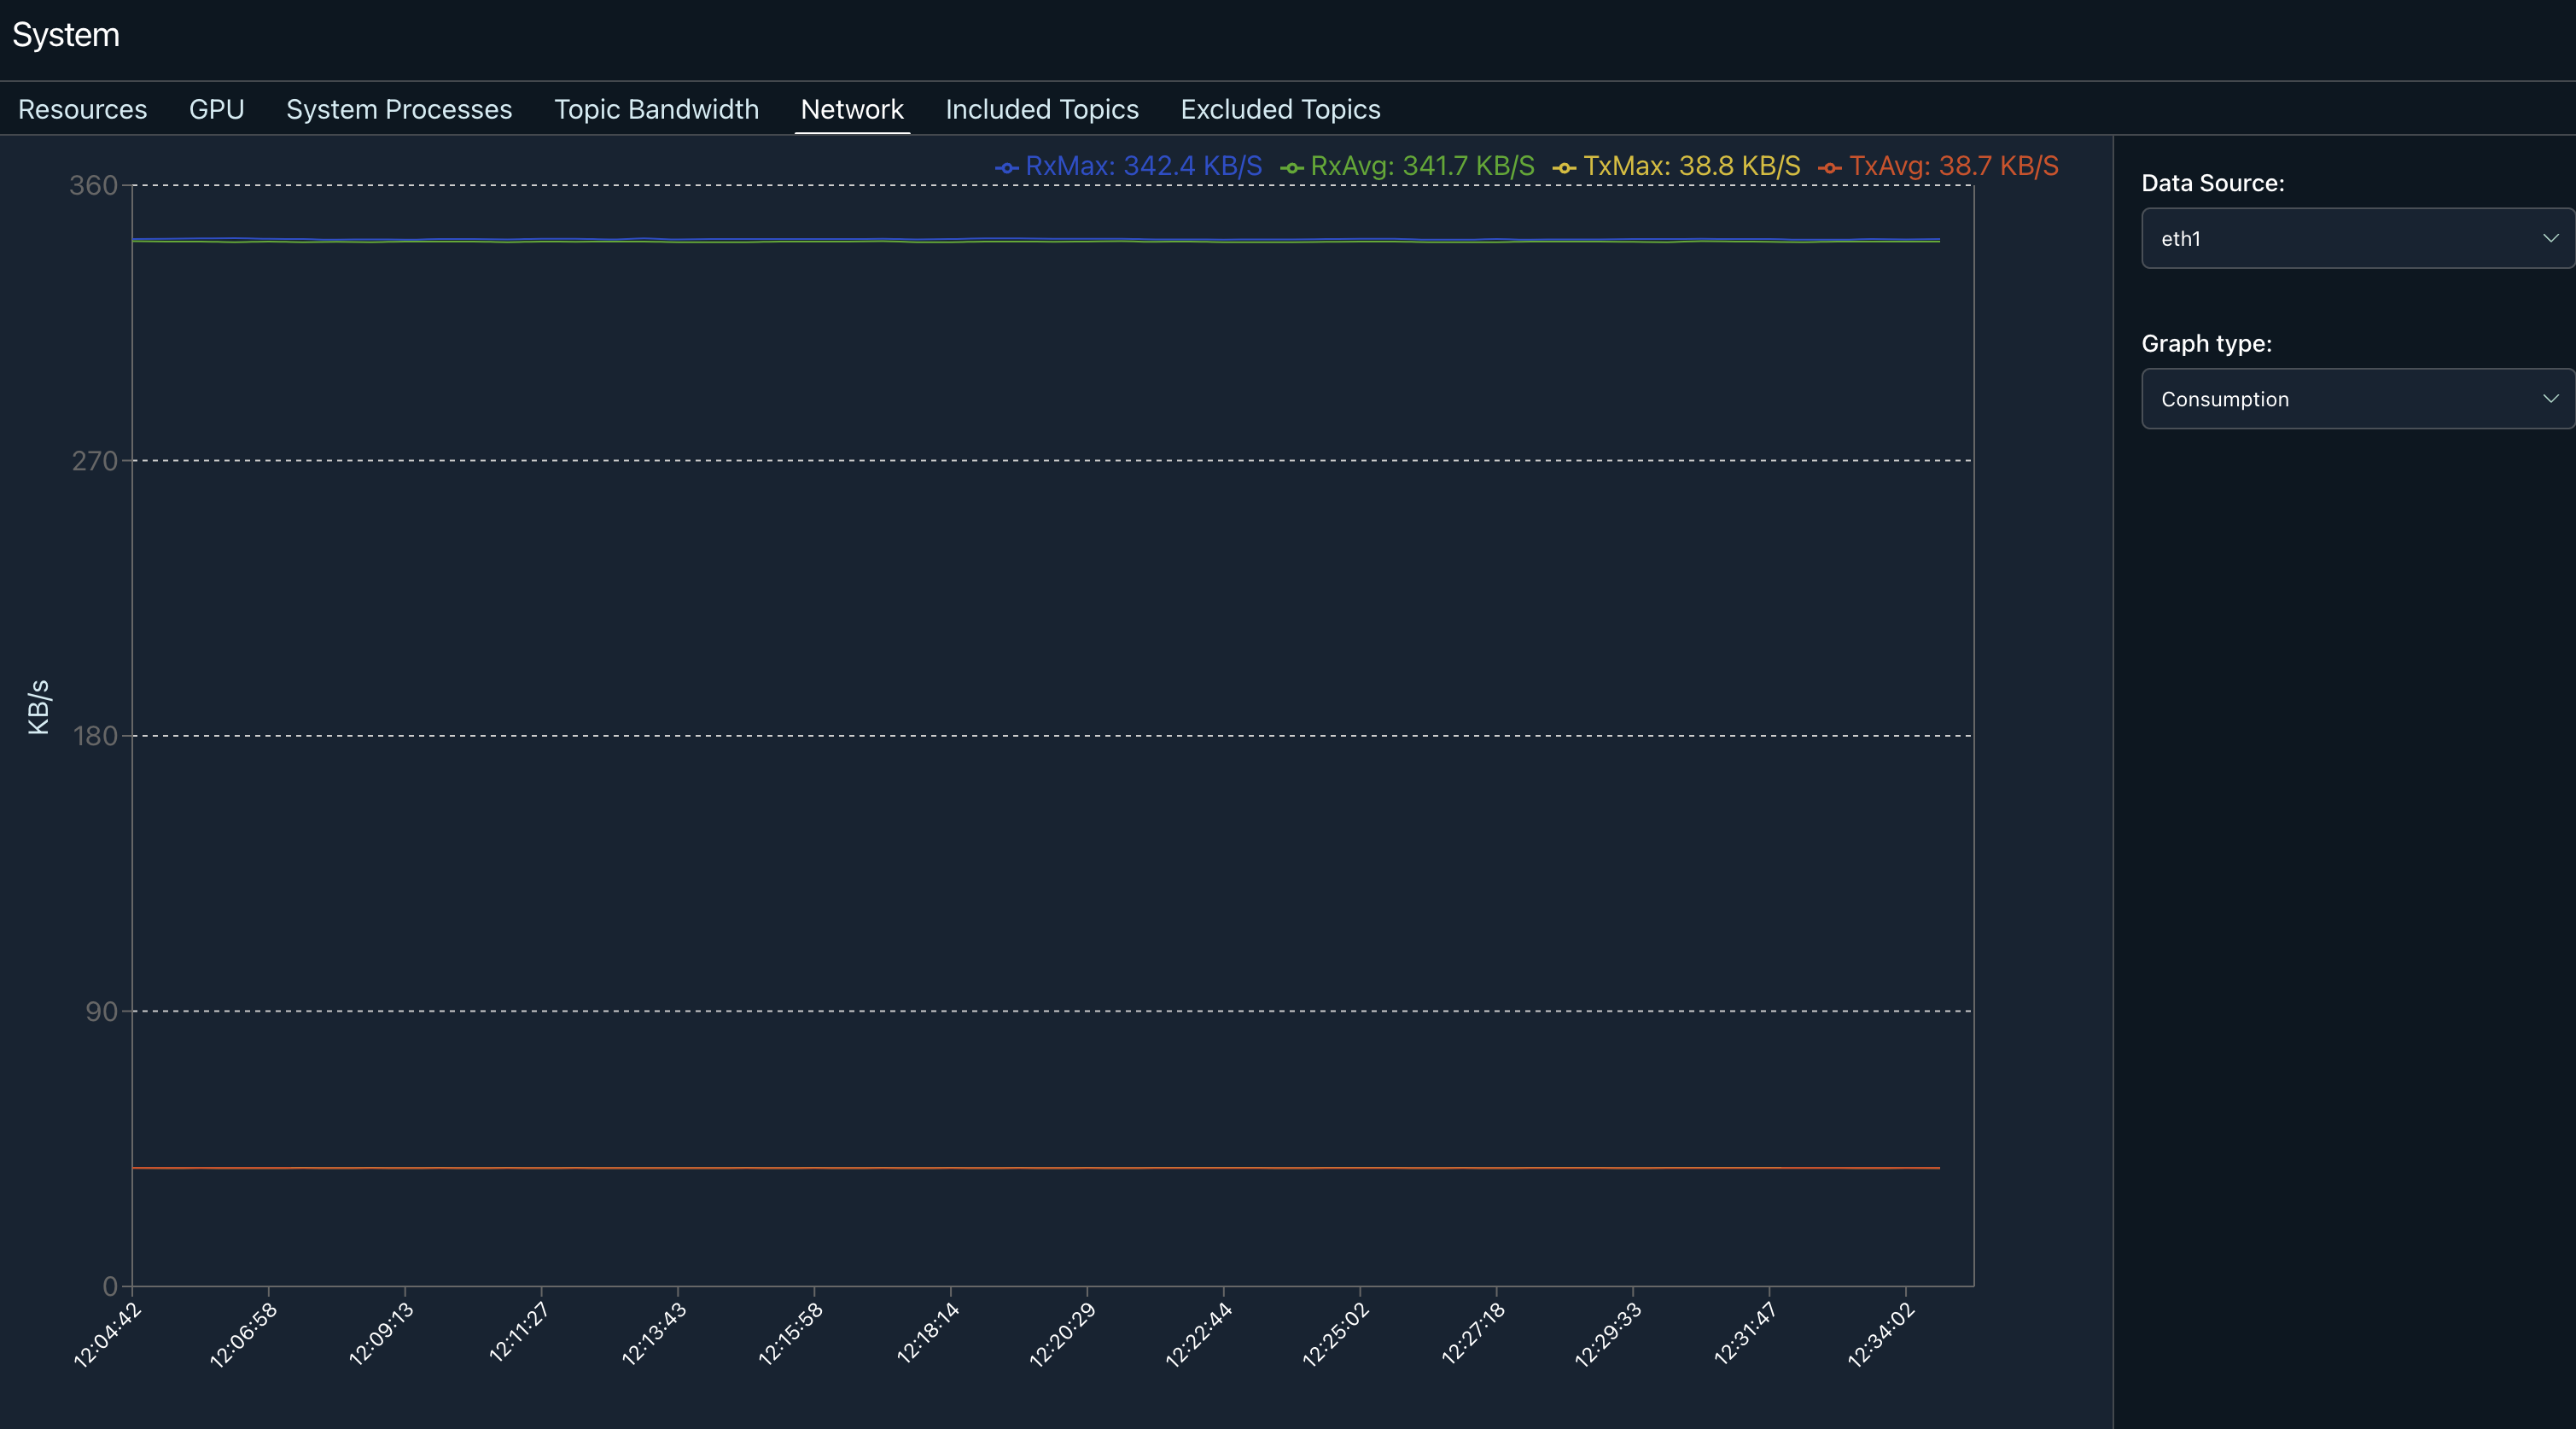
The consumption panel plots your robot's maximum and average receive (RX) and transmit (TX) bandwidth usage over time. This information is key to understanding your robot's connectivity requirements in different scenarios (e.g. passive monitoring versus active remote teleoperation).
If your robot's IP address is available, it will also be displayed here.
Plotting bandwidth usage over time allows you to determine average and maximum network bandwidth usage.
Updated about 4 years ago
