Resolve an Alert
You've done a great job generating alerts. Now it's time to start resolving them. Let's walk through the workflow to view, investigate, and resolve an alert.
Investigate an alert
Let's investigate an alert generated. In the Device Portal, the device list will show you alerts at the end of the column row. For example,

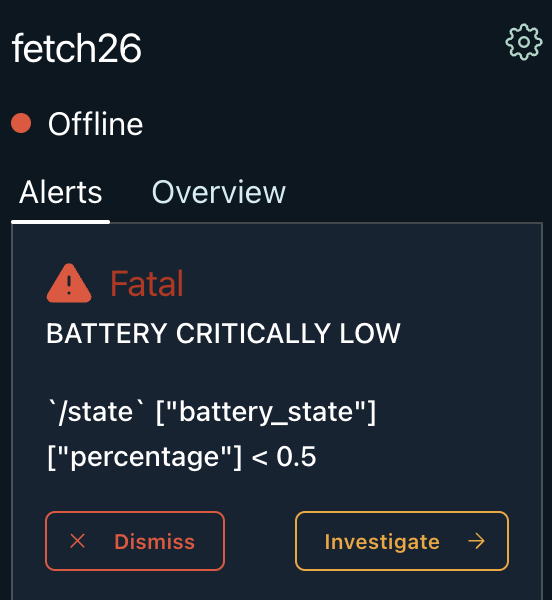
By clicking on the table row, a side panel will appear. The Alerts tab will show the active alerts that have triggered from the device. You can press Investigate to see more details on the alert.

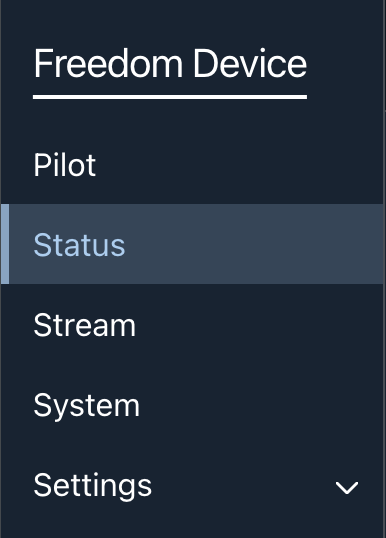
You will view the data stream starting from the moment the alert was generated. This full-stack replay can help you diagnose the issue and understand what went wrong. To view the device alert you can select the Status tab.

In the Status tab, you will see the list of active alerts by default. You can click Go To Alert to see more details. You also have the ability to resolve the alert by clicking Resolve.

Resolve an alert
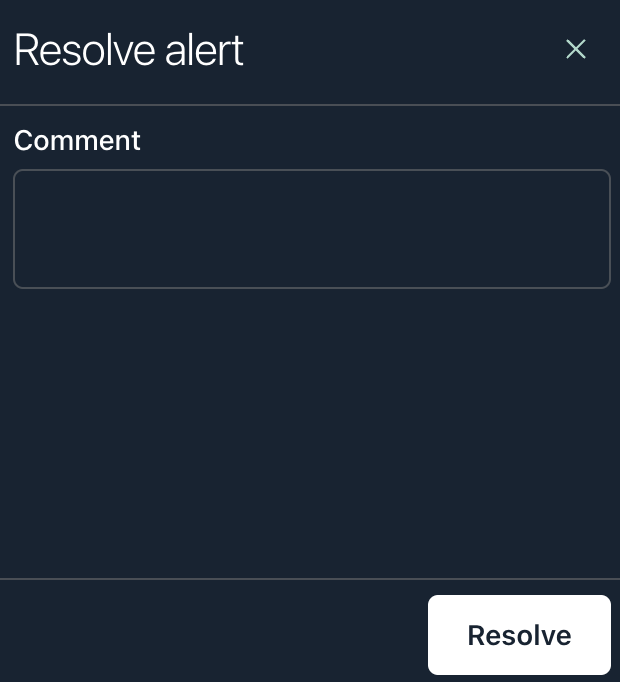
In the device dashboard, Select the Status tab, then click the RESOLVE button. Leave a descriptive comment to help your team understand why it is being resolved, then click RESOLVE.

Updated about 4 years ago
