Welcome!
Getting Started 👋
Freedom Robotics helps operators manage their robots in a reliable, safe, and fast way. Our goal is to reduce operator and engineering by providing:
- Monitor and manage individual devices with the Stream Dashboard and Pilot View
- Incorporate zones to organize devices, view live maps of your factory, and monitor alerts
- Empower your processes by incorporating automation projects to execute tasks given conditions
After logging into the application, the first page you will see is the Mission Control Page.
This view will provide users:
- quick access to recent pages, devices, and zones the user has viewed
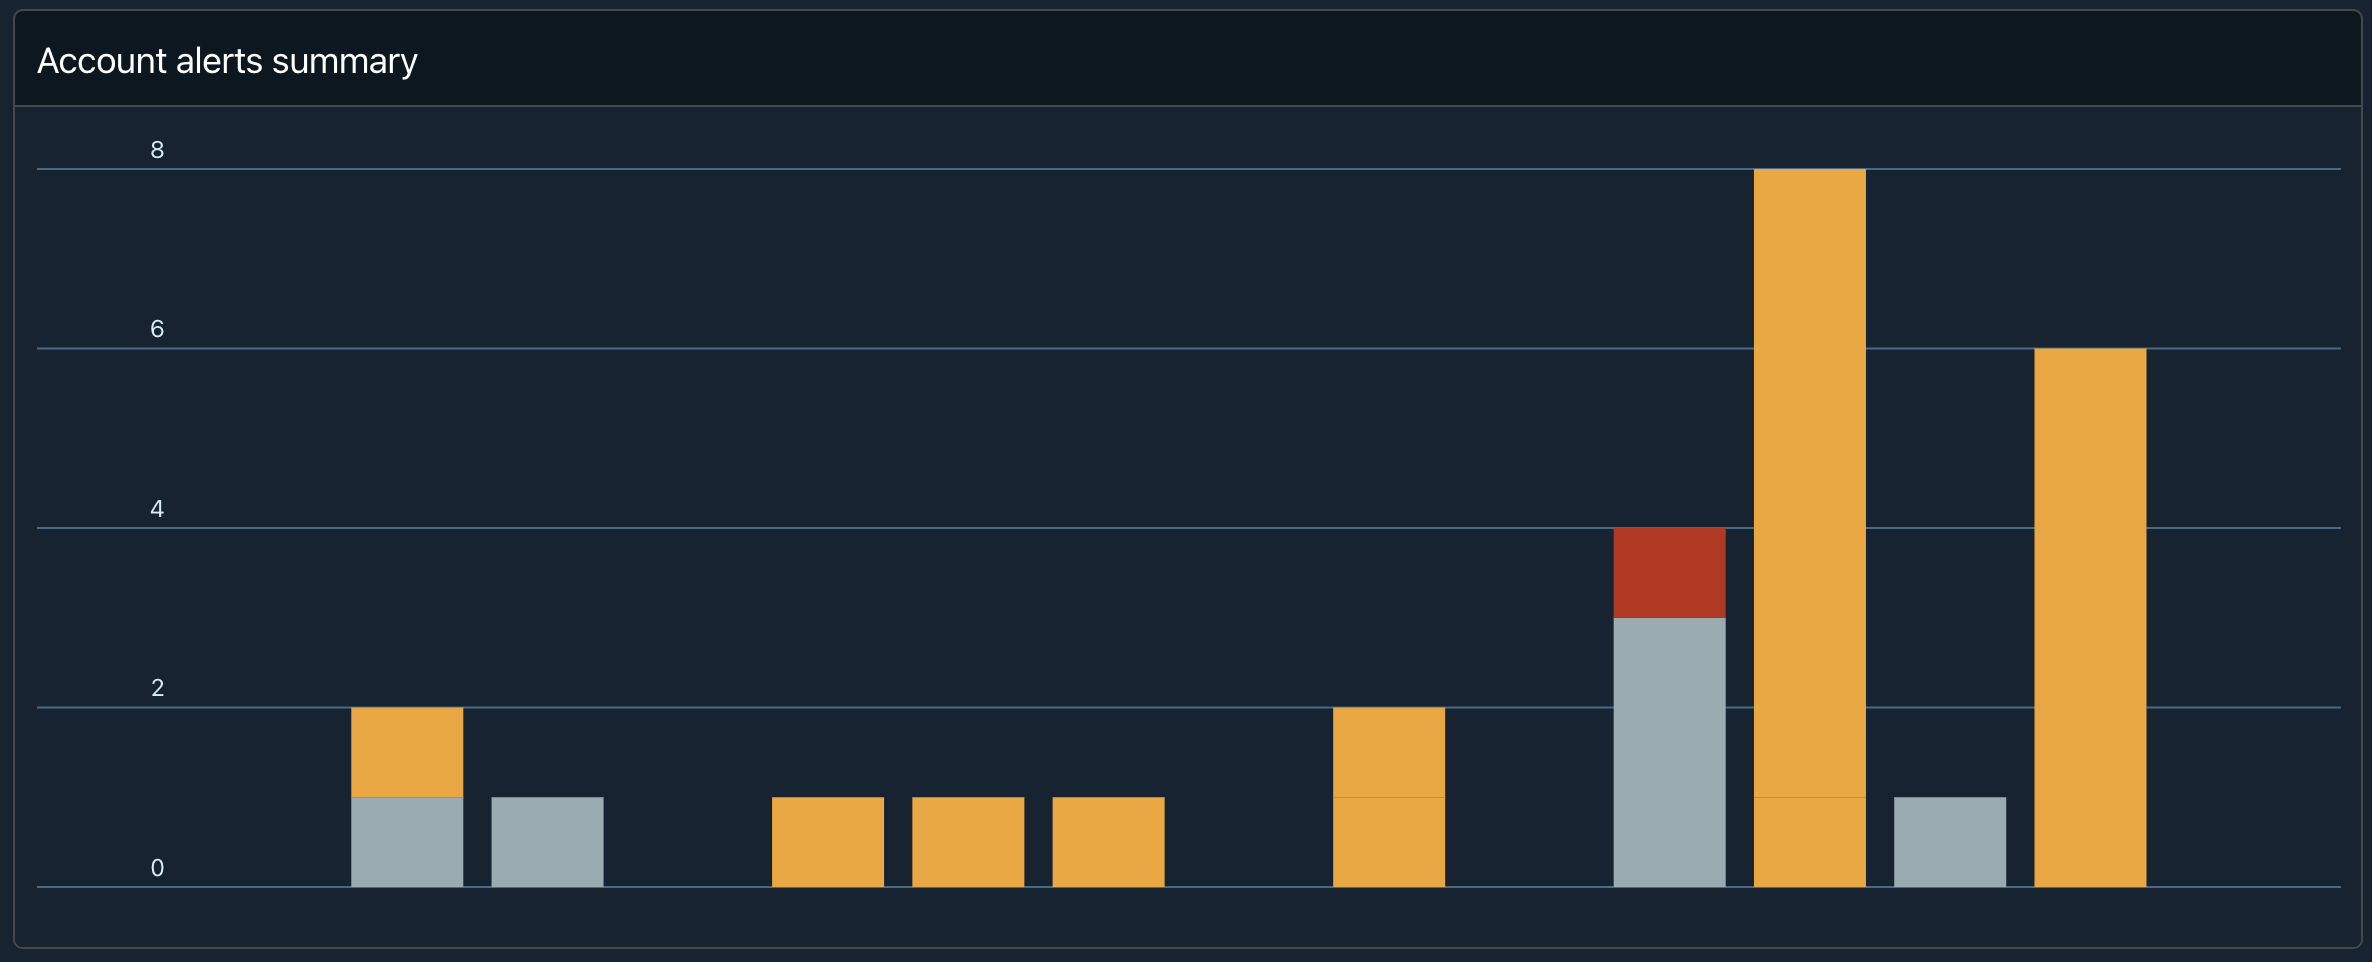
- a summary of account alerts based on all devices
- quick actions to create a device or zone
Edit Layout Mode
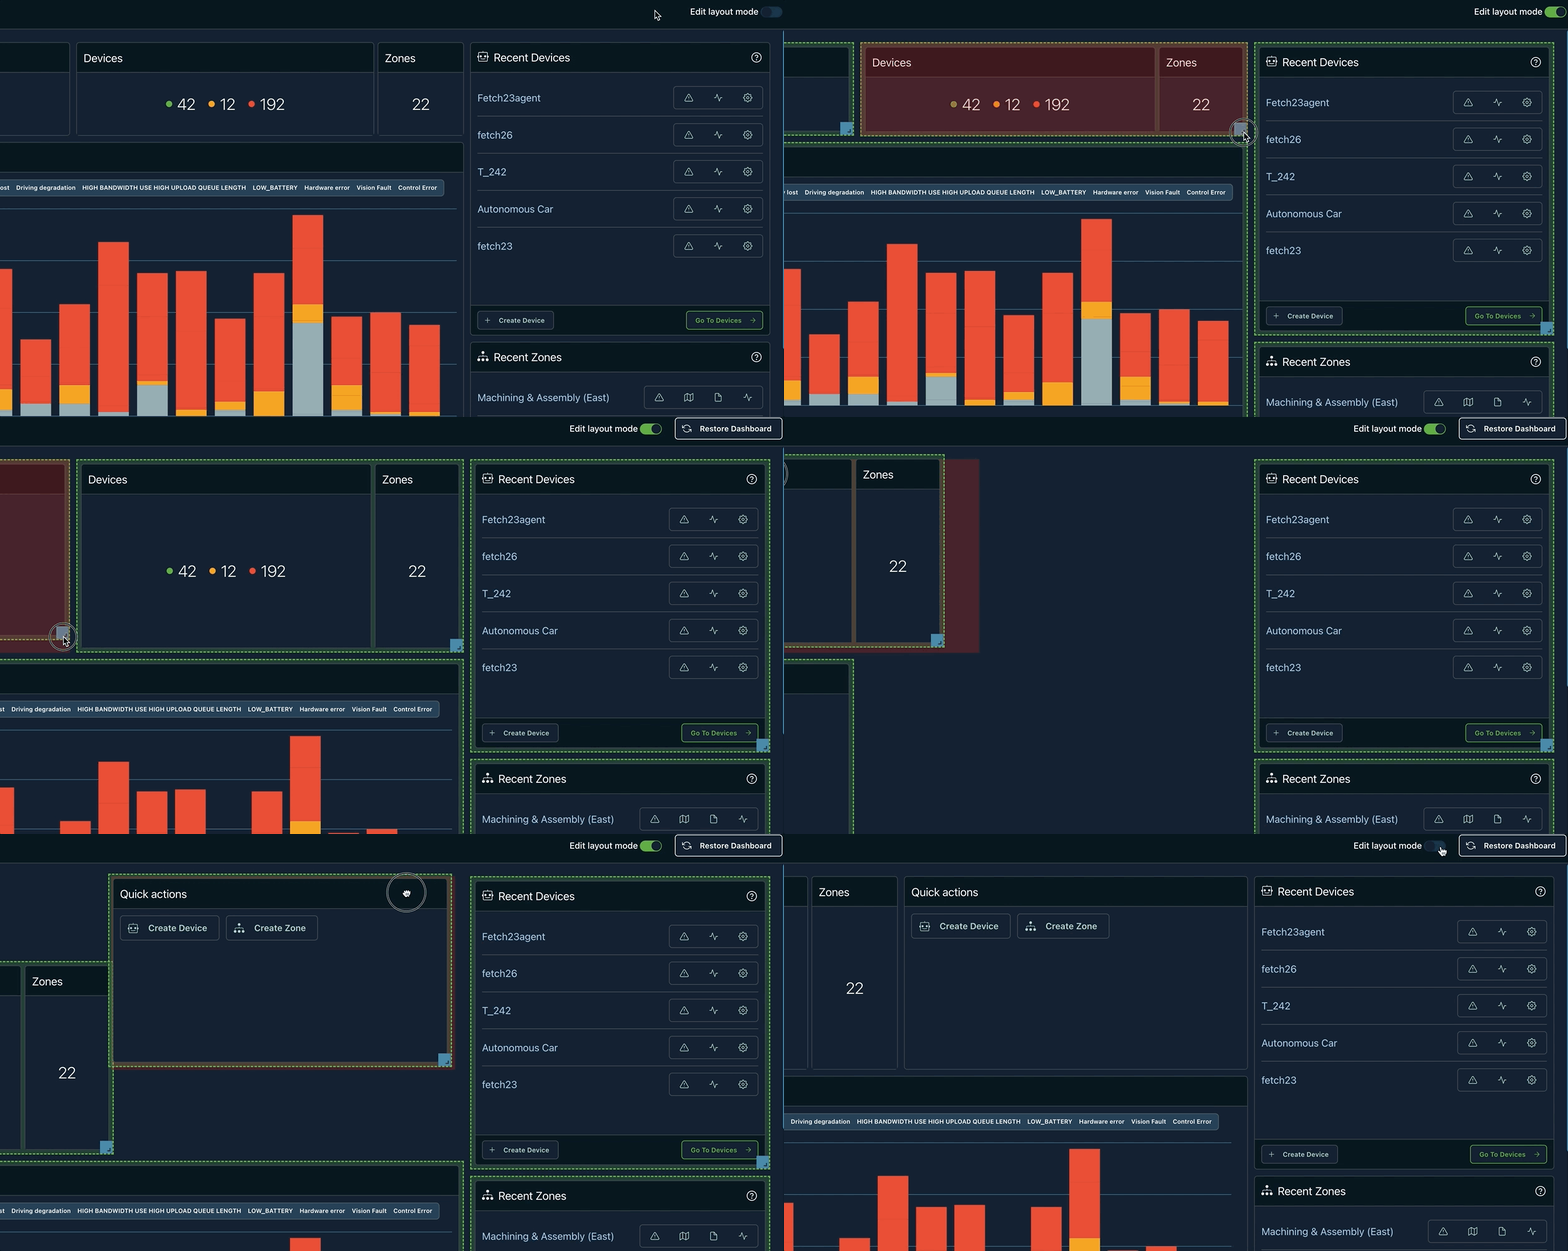
To better support user's preferences with customization, we provide the ability to rework the dashboard widgets by toggling the Edit layout mode button.
Toggling this will allow you to rearrange and resize the cards. This is located in the top right of the Mission Control Dashboard. An example is shown below where the cards can be moved around by clicking on them.
The blue arrow in the corner can be held down to drag and drop and change the size of the card. You will see a red background color where the card will be placed.

Restore Dashboard
In the case that you do not like the organization of your view, you can reset back to the default view by clicking Restore Dashboard. After making changes to the dashboard, this button will appear. This button will reset the dashboard view back to the default view.

Quick Actions
To increase efficiency, users have the ability to create devices or zones from the main dashboard. Create Device will open the device creation form and Create Zone will open a right panel that allows to create a parent or sub-zone.

Devices
The Devices card shows a high level count of device statuses. The following statuses are:
- active devices (green)
- inactive devices (yellow)
- offline devices (red)

Recent Zones
Recent Zones was built to assist the user who frequents the same zone and save time with app navigation. From the home page, they can quickly dive into the zone they were previously working in.
This card will show the last 5 zones you visited similar to recent devices. It is composed of two components:
- Name (Clicking on it will take you to the zone management page)
- Quick Action Icon Bar (Alerts, Maps, Reports, Statistics)
Clicking the respective quick action icon will navigate you to that page. For example, clicking the Freedom Factory SF Statistics icon will guide you to the Statistics Page for that zone.
You have the ability to clear the recent zones from your user profile. This will reload the page.
Recent Devices
This will show the 5 most recent devices you visited, similar to recent zones. It is composed of two components:
- Name (Clicking on it will take you to the device's stream page)
- Quick Action Icon Bar (Alerts, Stream, Settings)
Clicking the respective quick action icon will navigate you to that page. For example, clicking the conveyor settings icon will guide you to the conveyor's Settings Page for that zone.
You have the ability to clear the recent devices from your user profile. This will reload the page.
Accounts Alert Summary
This histogram will show you a chart of the account's active alerts. Hovering over each item will tell you the count for that specific bar.

Now that you have an understanding of the the main dashboard page, let's move onto device management!
Updated almost 4 years ago
