Fleet Alerts
Overview
To give users a better idea of how operations are running, you can generate alert reports. Users have the ability to review their zone's alerts, view them from specific date ranges, investigate specific alerts, and download alerts in csv format for custom analytics.
Navigation
- Click Fleets.

- Click Alerts.
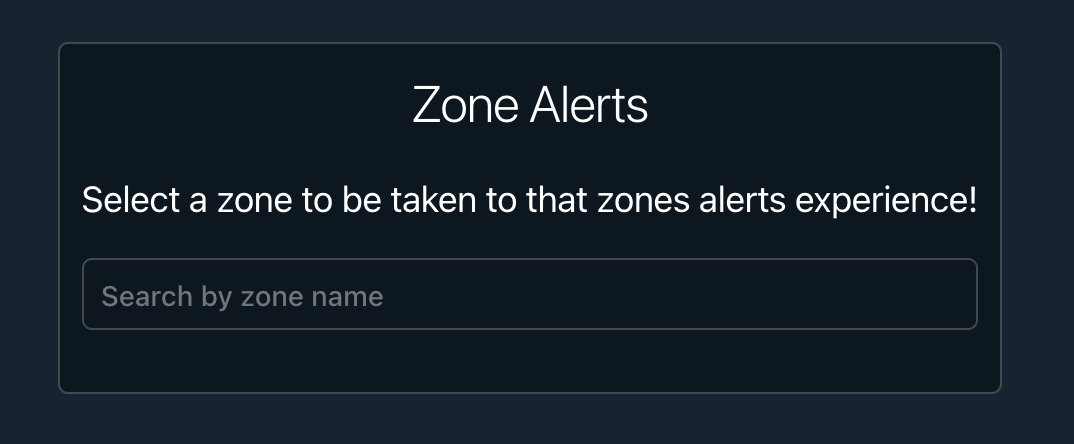
- Click the input.
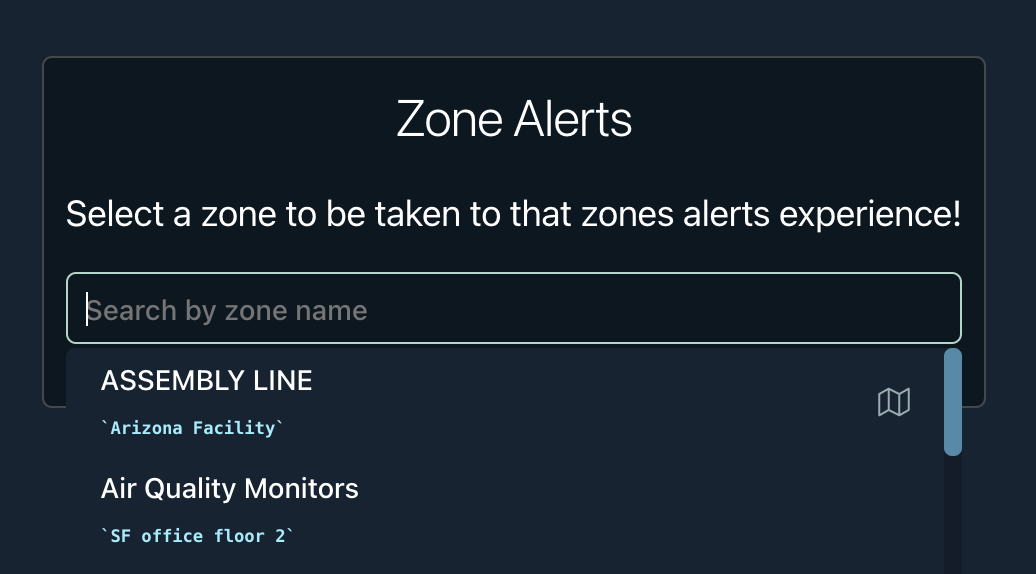
- This will allow you to filter for a zone or select one from the dropdown list.
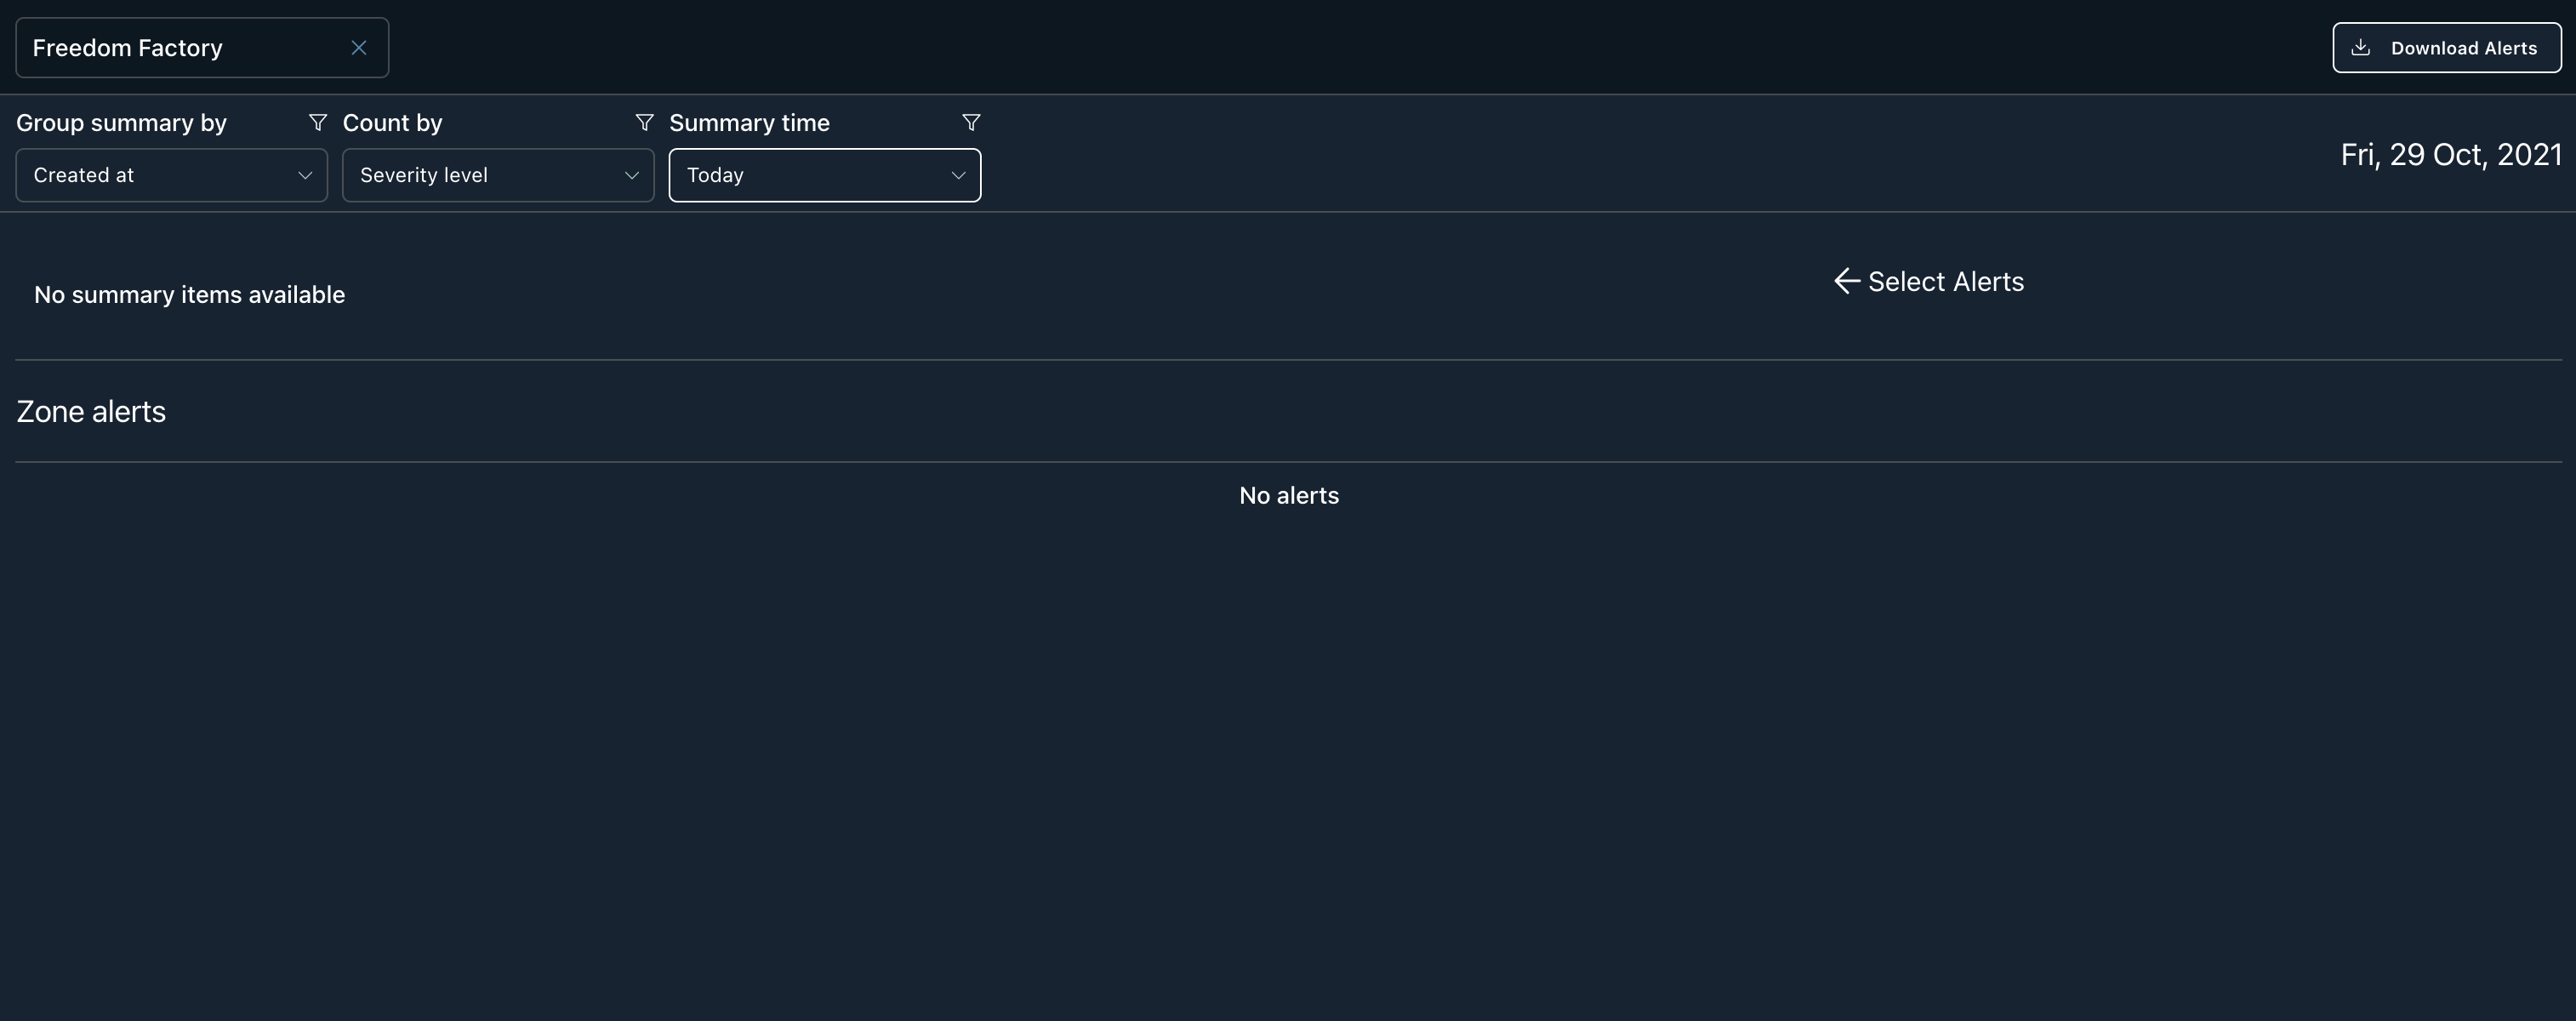
- After selecting a dropdown, you will be navigated to the Alerts Page for that Zone.
Filter Options
Count by
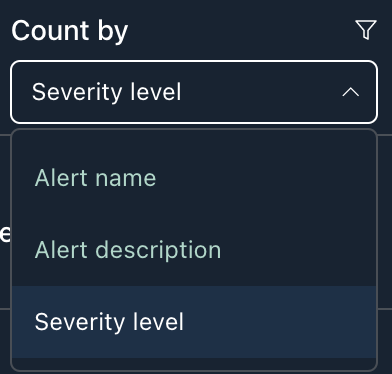
The first filter is "Count by". This filter will sum the alerts by the choice specified. The following options to count by are the name, description, and level of the alerts.
Group summary by
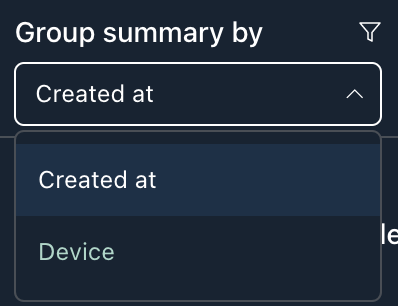
The next filter is "Group summary by". This filter will alter the x-axis of the histogram. The following options to group by are the created at timestamp and the device name.
Summary time
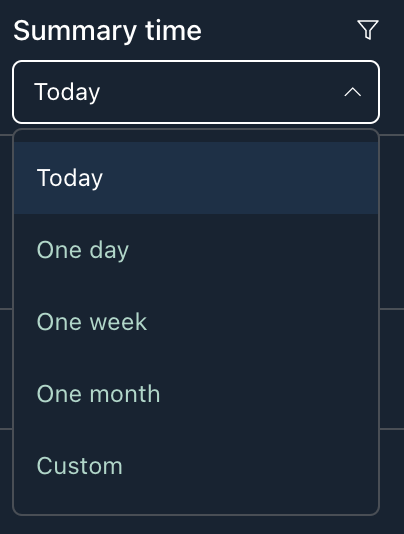
The next filter is "Summary time". This filter will update the time window in which you want to retrieve alerts. The following options are today, one, day, one week, one month, or a custom date range.
With these filters you can generate various histograms and review the specific alerts in a table below. For example, sorting by "Severity level" will show the collection of alerts grouped by hour if you selected a time frame of "Today".
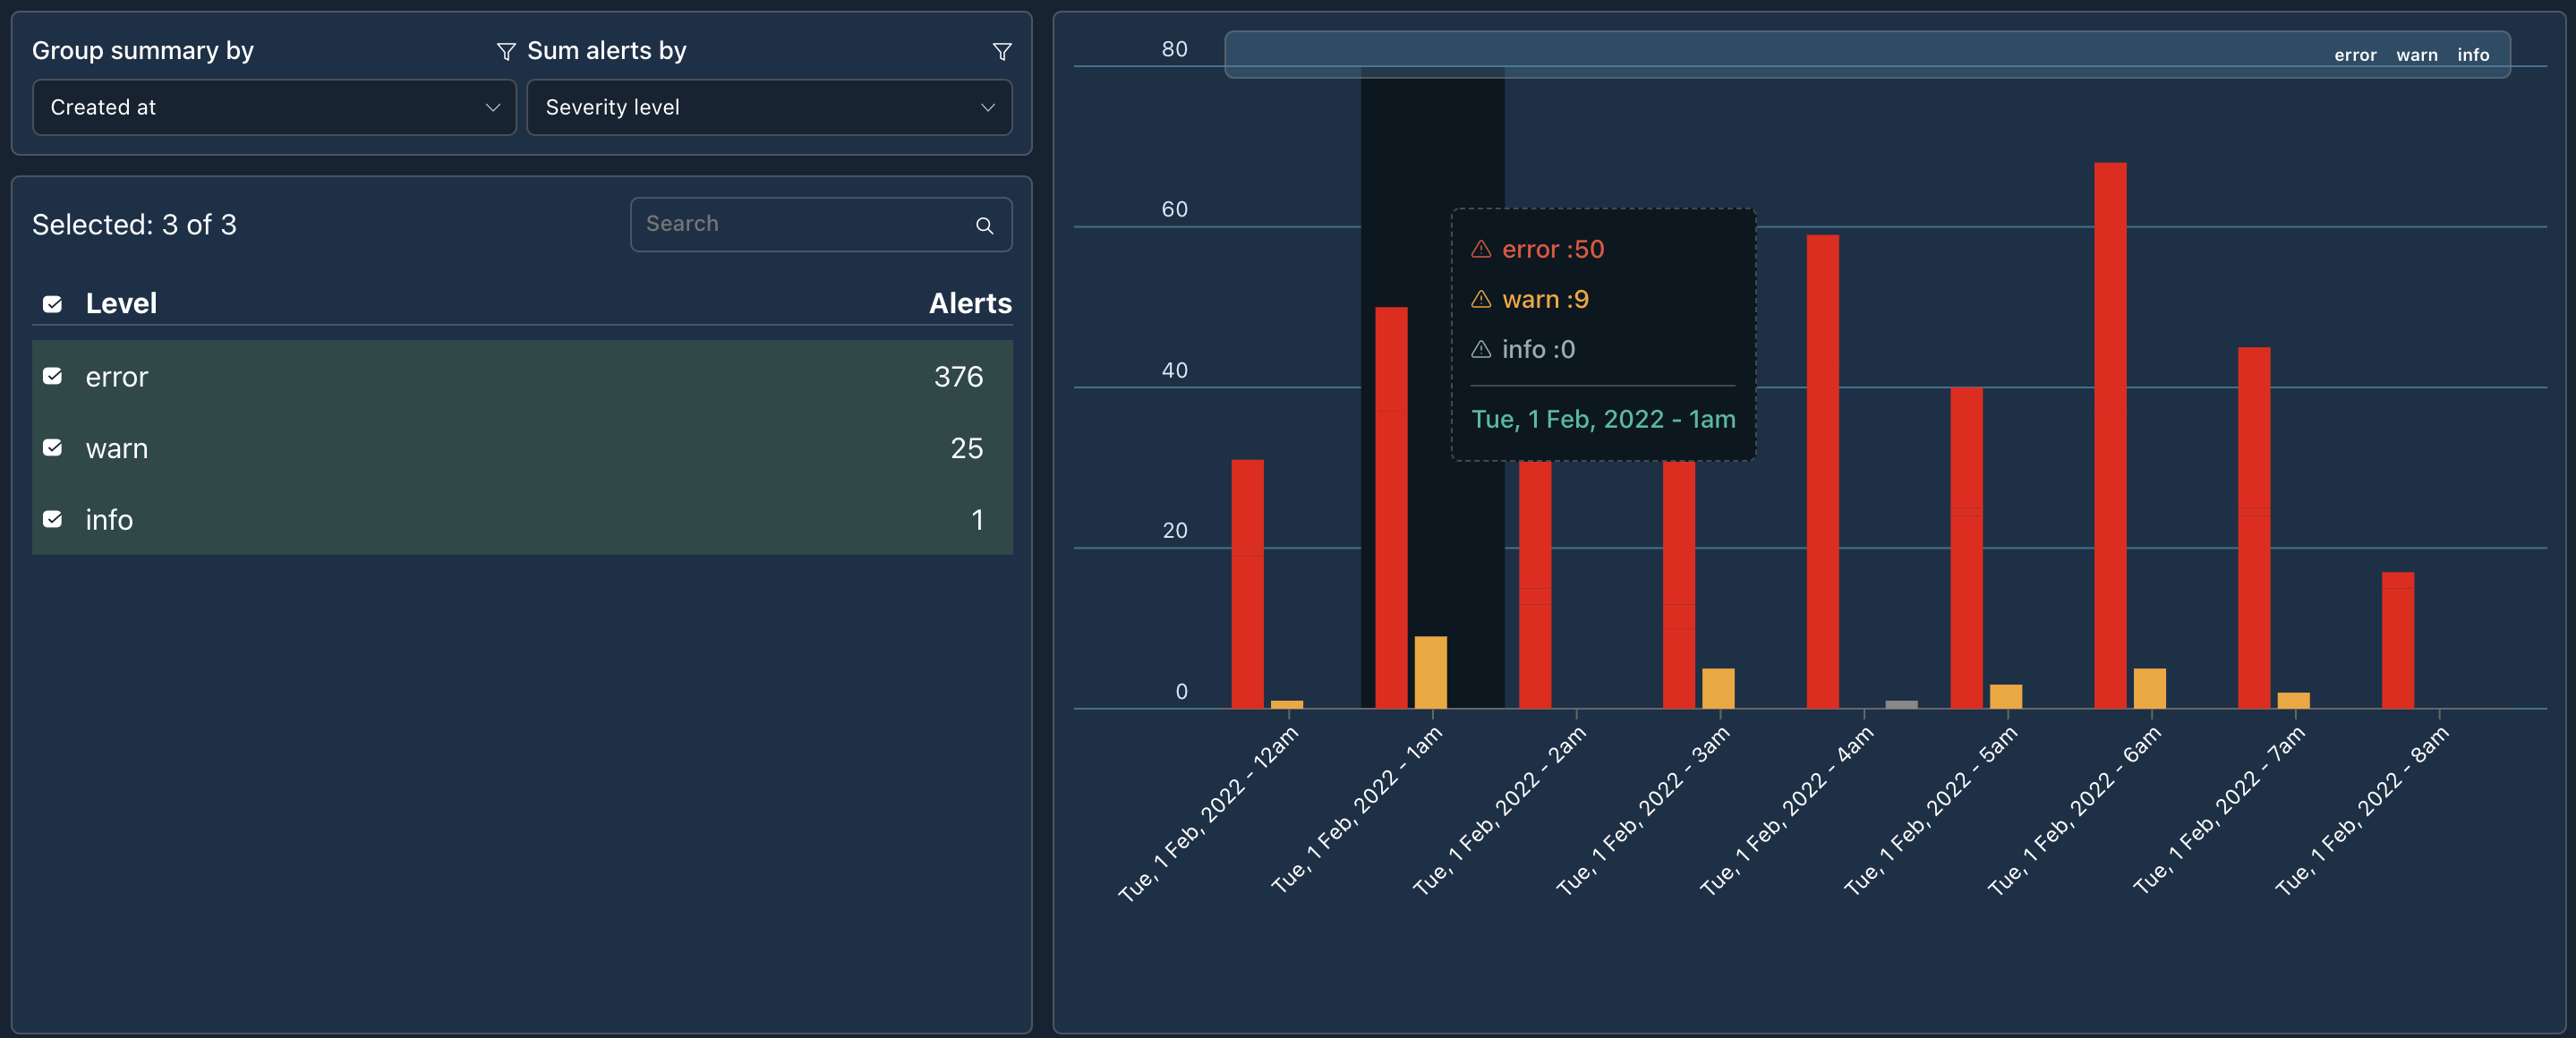
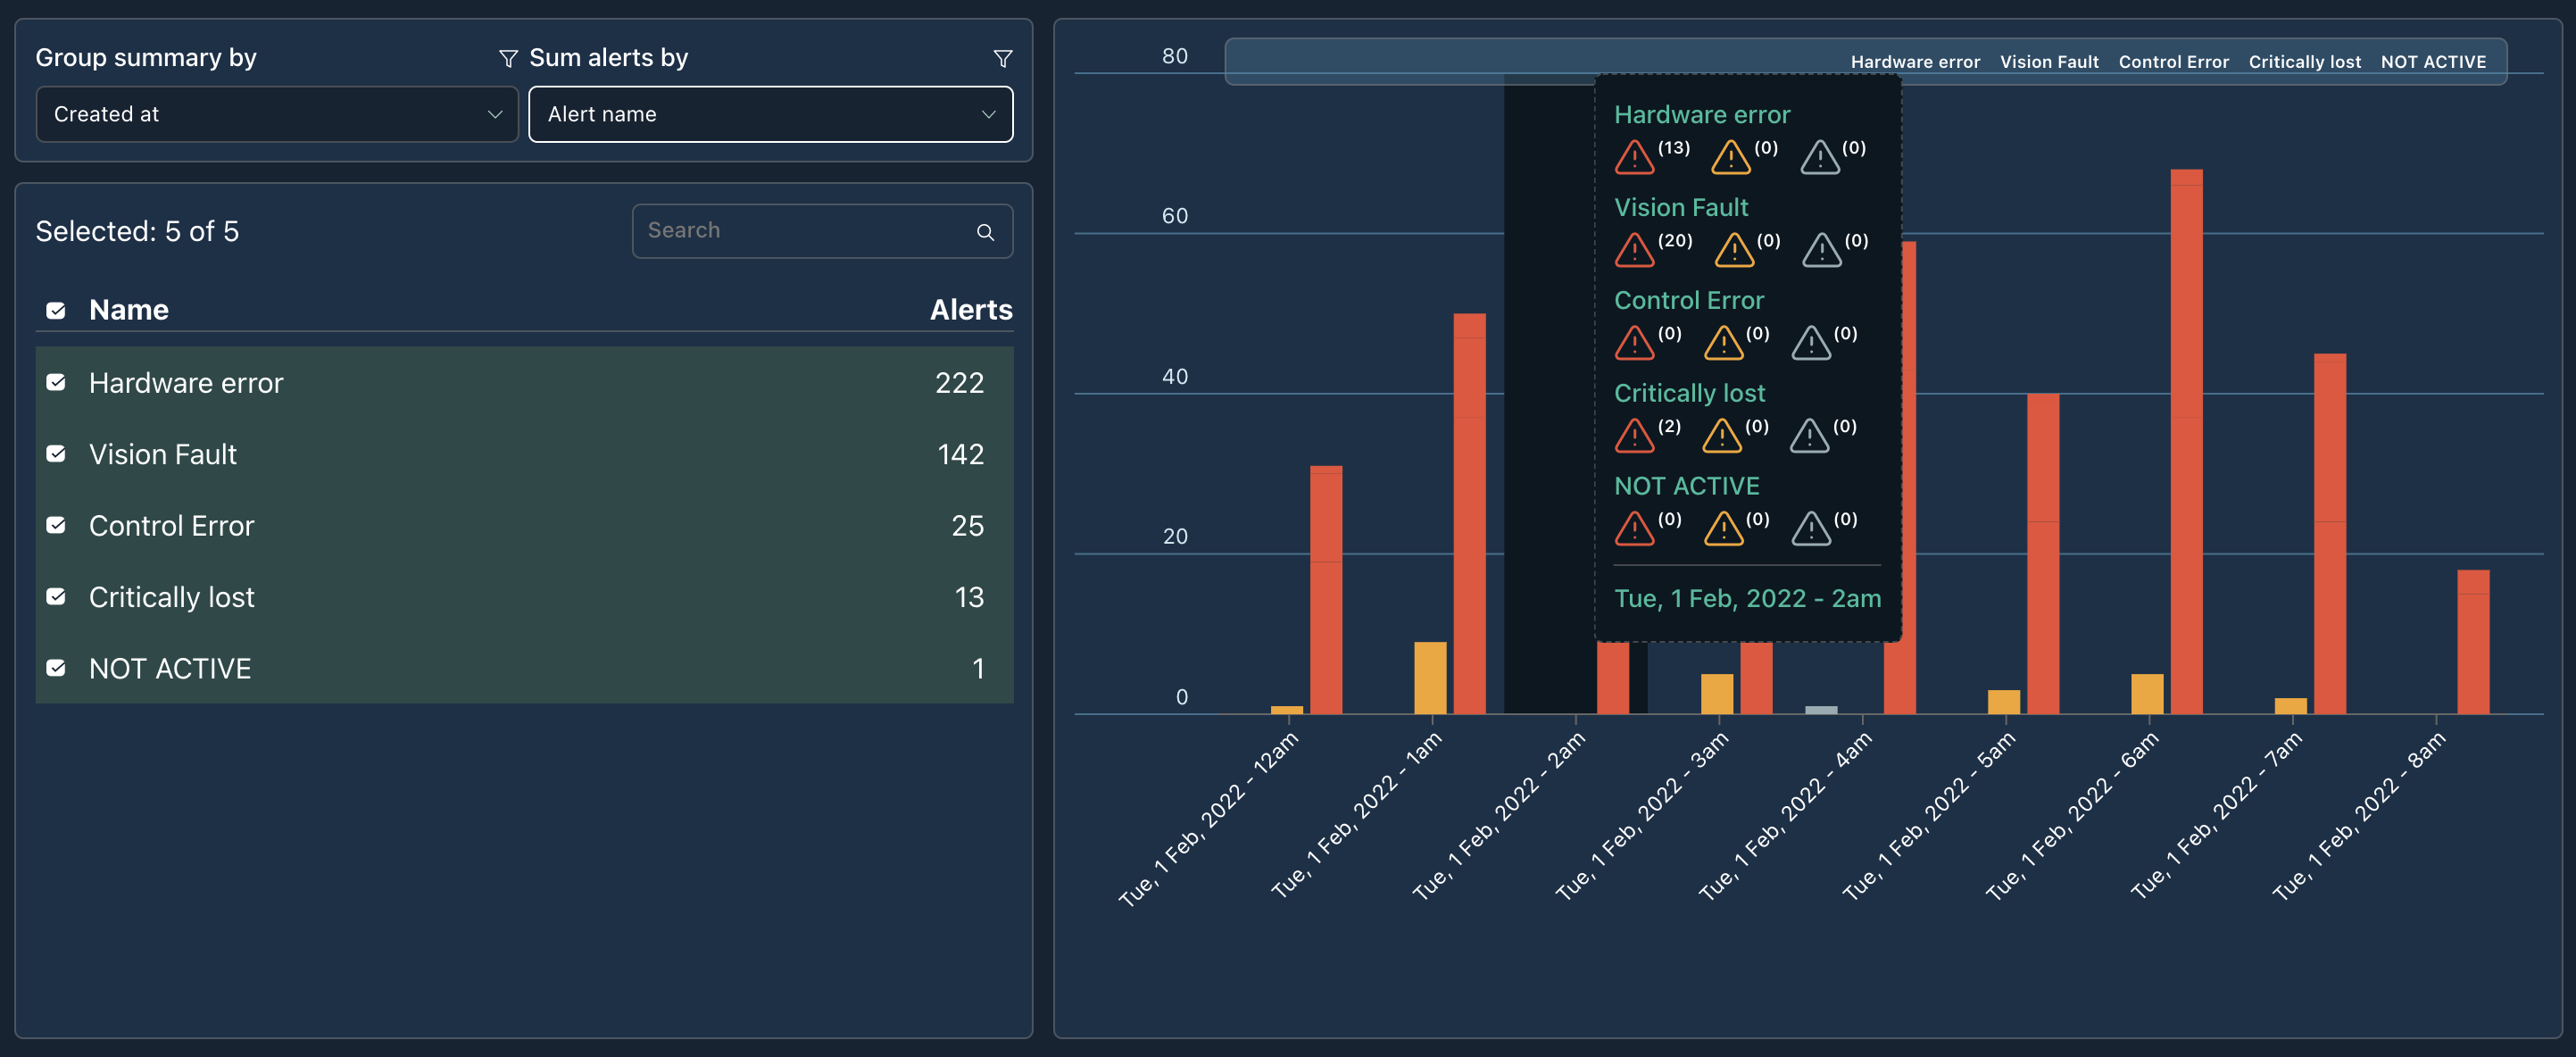
An example of sorting by alert name is shown below. Each Name will be listed as you hover over the bar. It will indicate the severity level associated with the name. At the bottom of the label is the date.
Download Alerts
In the top right corner, there is a button to generate alerts.
Download Alerts Cap
Currently a list of alerts that exceed 10,000 will not be downloadable.

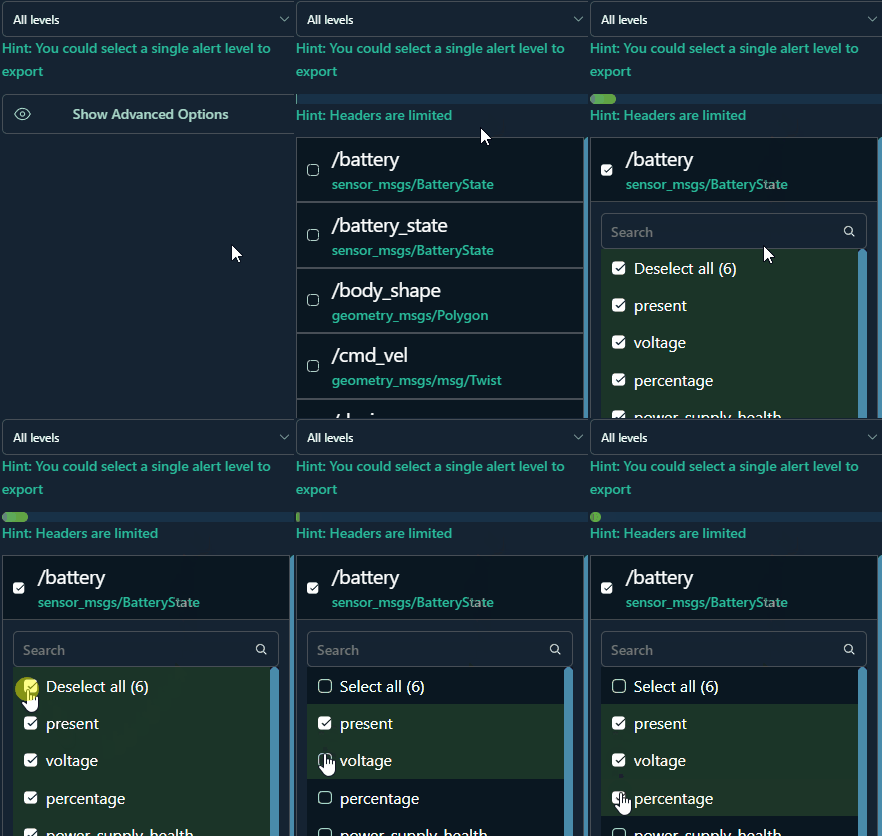
You can specify the alert type you want to download and add additional headers by *clicking *Advanced Options.
Advanced Options
Advanced options will show a list of known topics you can add to your download report. Each parent property will be selectable, and you can control which child property to add/remove from the alert report. For example,
Alert Action buttons
In the table, each alert will have two actions:
- Resolve / Resolved : Notifies the user that alert is unresolved and can be manually resolved or the alert is already resolved.
- Go To Alert: Will navigate you to the alert details of that alert

Table Filtering
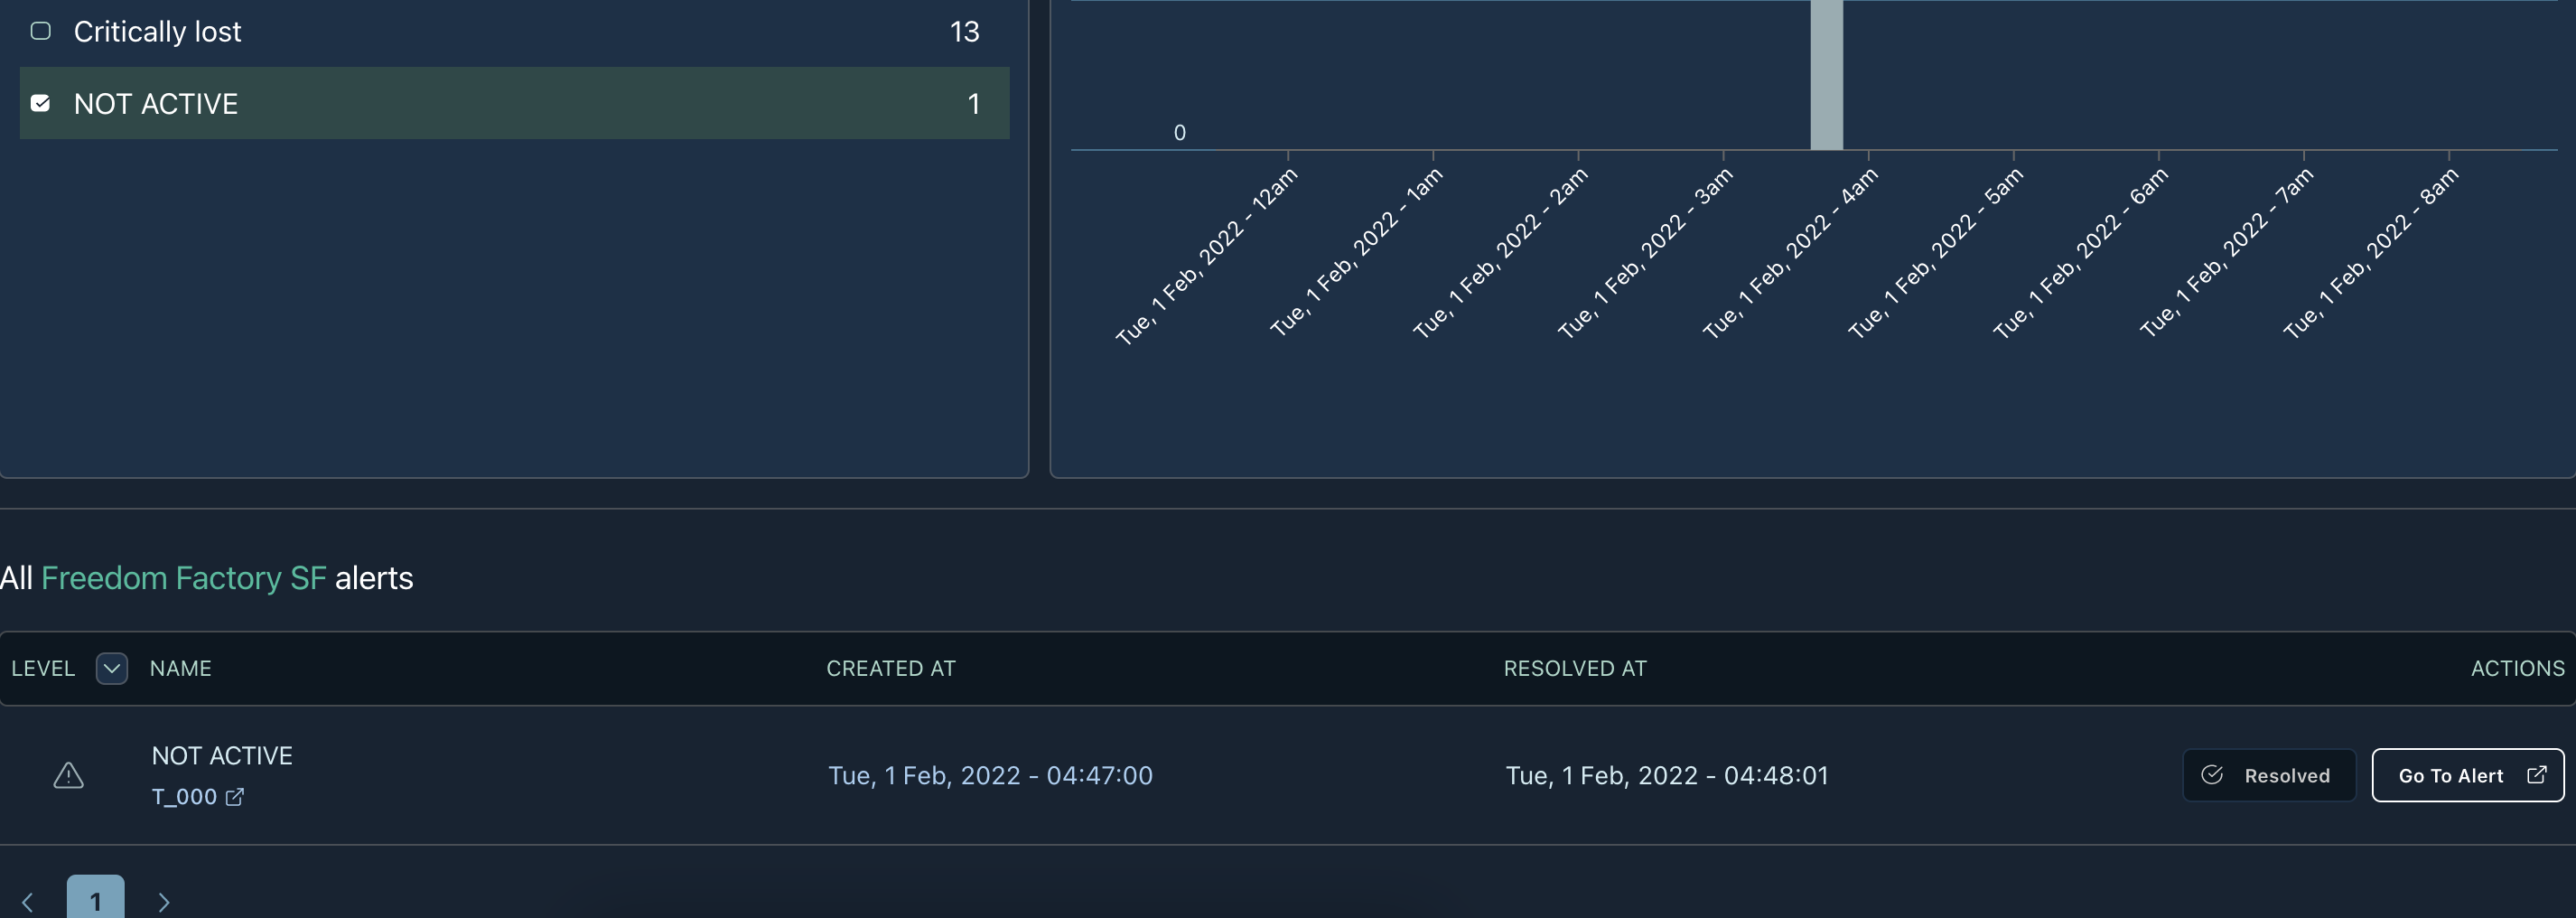
The table will also be filtered based on the results selected in the chart above. For example, only NOT ACTIVE is selected and the table will reflect that filter.
Updated over 3 years ago
