Configure Topics
How topics work
Topics are the way that you (and Freedom!) organize your data efficiently. Every topic has a name to identify it and a type to specify the format of the data. Freedom uses topics to understand what data should be uploaded from your robot and where commands should be sent.
Naming topics
You may have hundreds of topics of data that you want to upload, so naming your topics clearly is important.
Best Practice:
- All topics must start with
/and be unique per device - Only lowercase alphanumeric characters plus
/and_may be used - Related topics should be grouped by prefix
Examples of well-formed topic names:
/platform/battery/status/platform/battery/voltage/cameras/front/image_raw/cameras/front/image_description
Topic Types
While you're free to define your own types, the ROS schema is often a good starting point. If you'd like to learn more about ROS type definitions, the documentation for std_msgs and sensor_msgs is a good place to start.
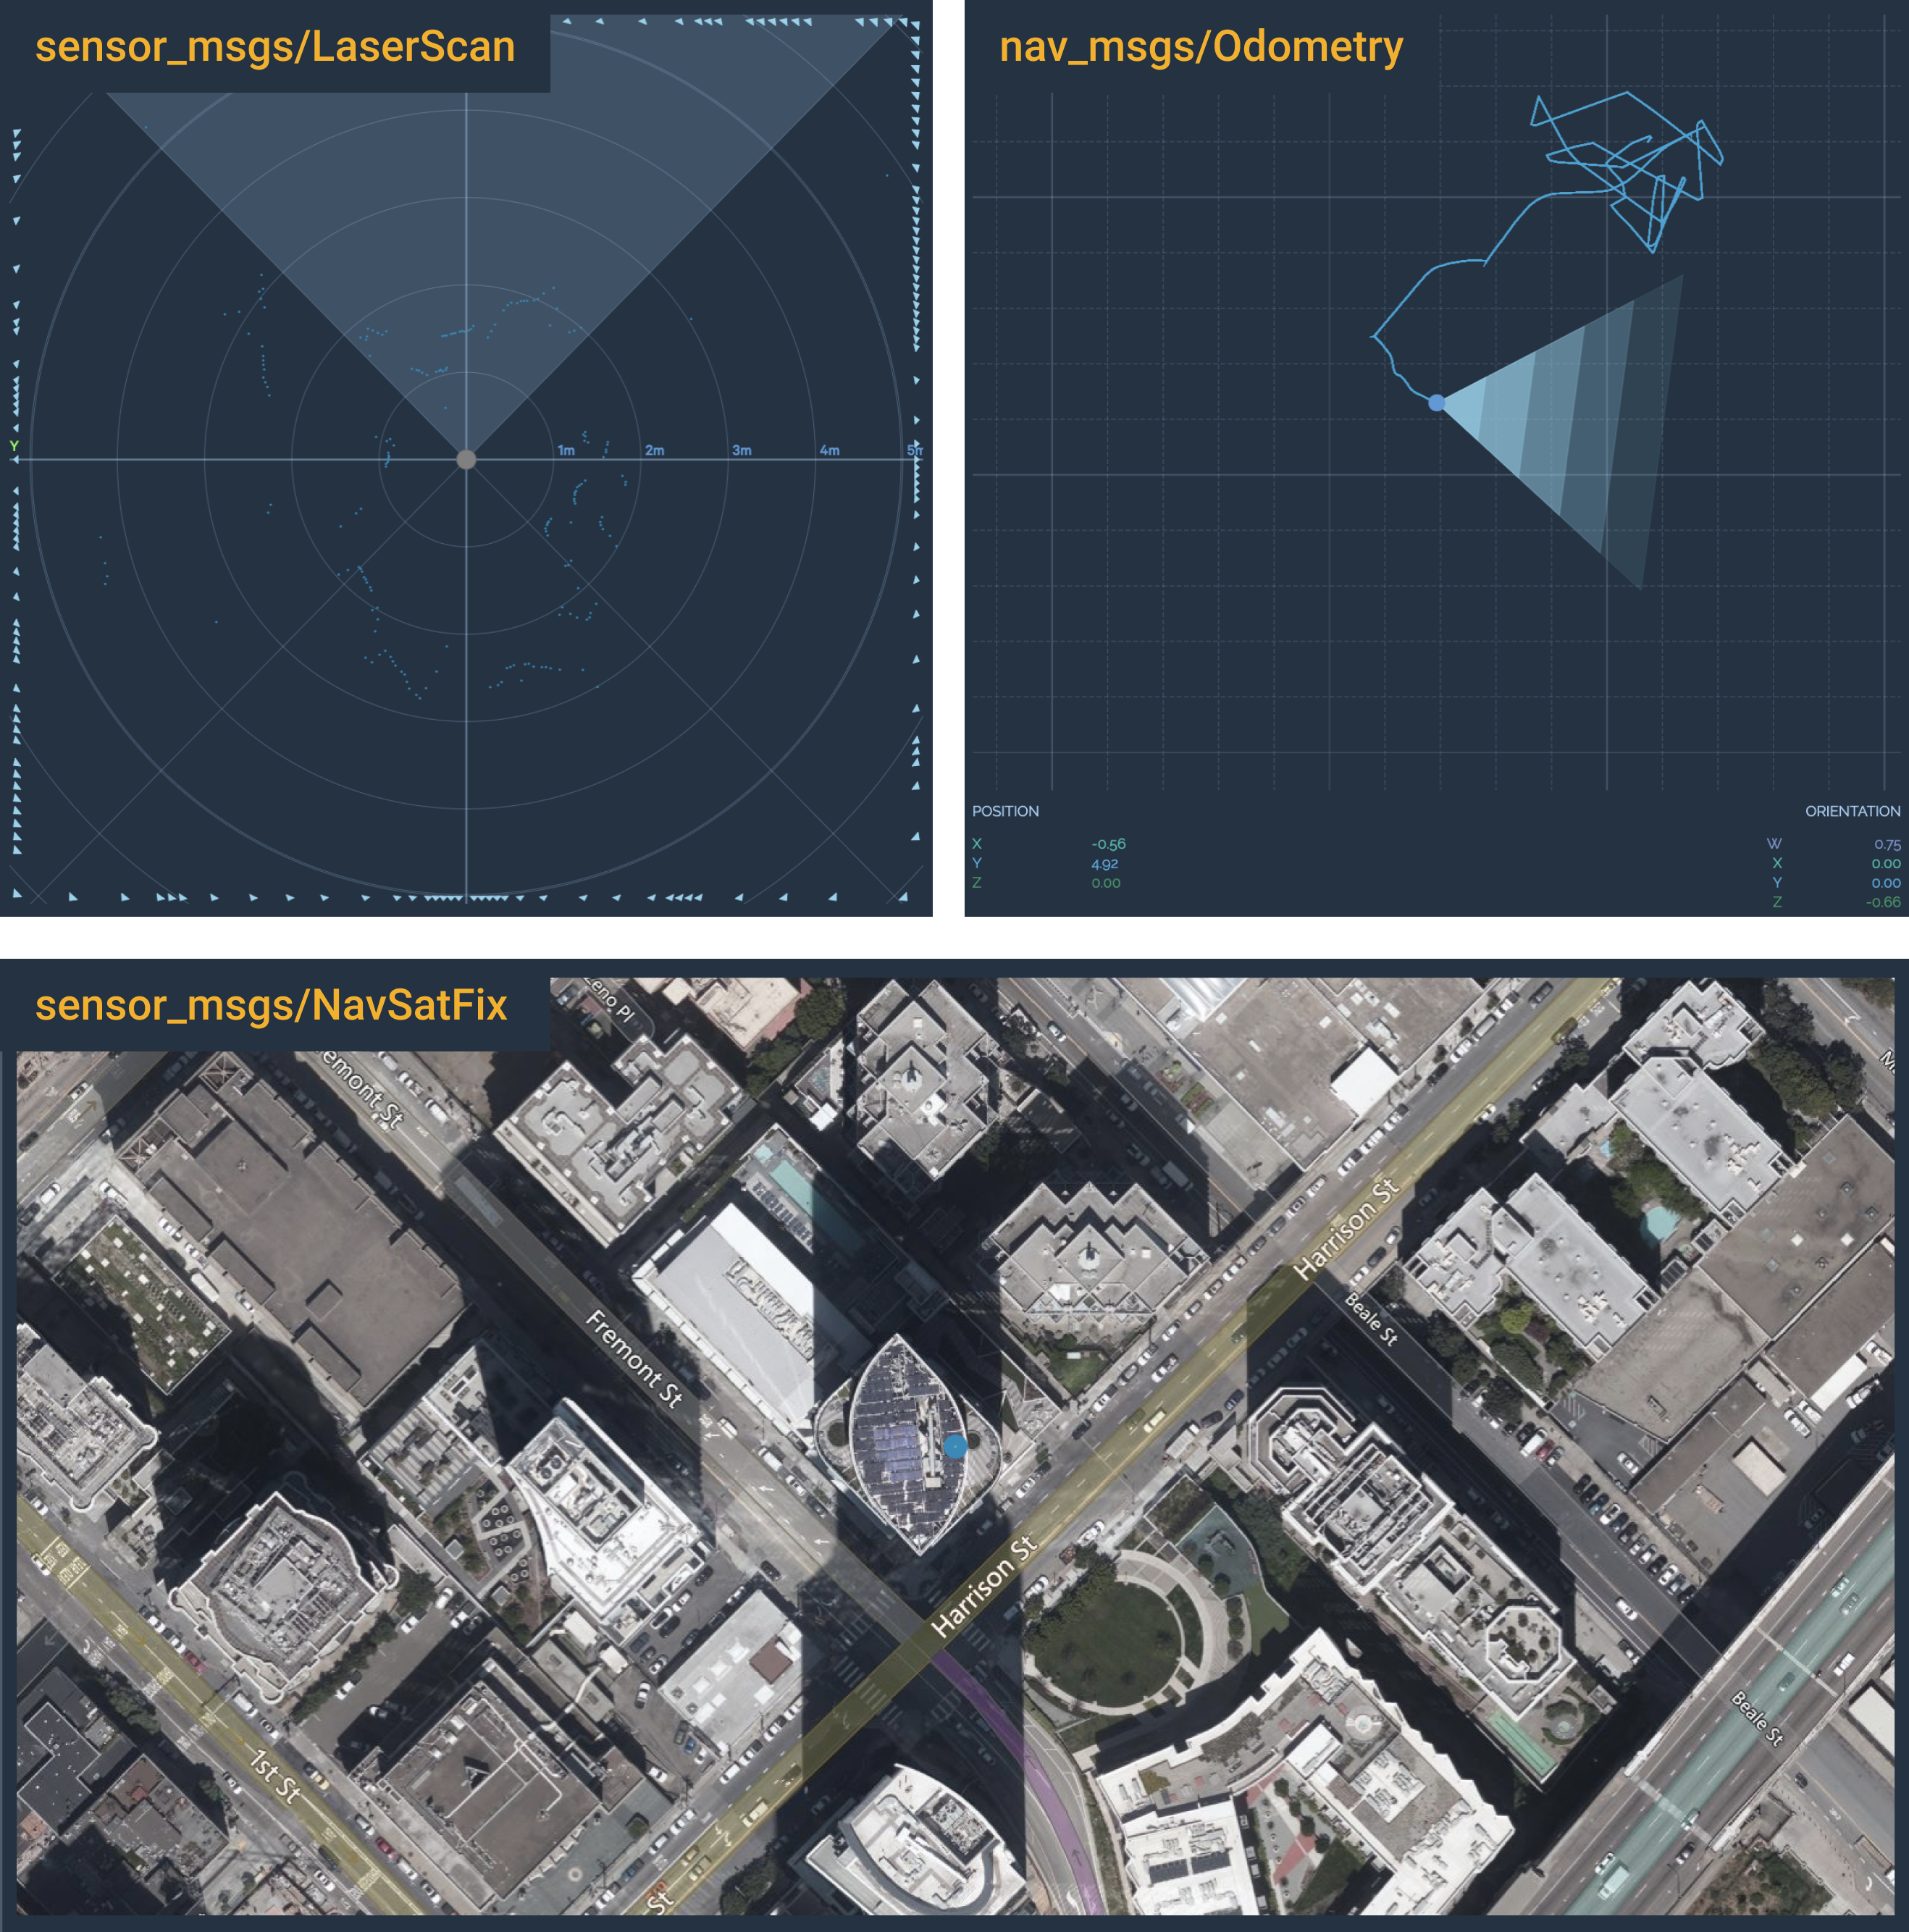
Freedom provides intelligent renderings for common types including:
- Location (
sensor_msgs/NavSatFix) - Odometry (
nav_msgs/Odometry) - LiDAR (
sensor_msgs/LaserScan) - Video and images (
sensor_msgs/Image)
... and more! Here are a few examples:

Examples of visualizations for common topic types.
Topic Settings
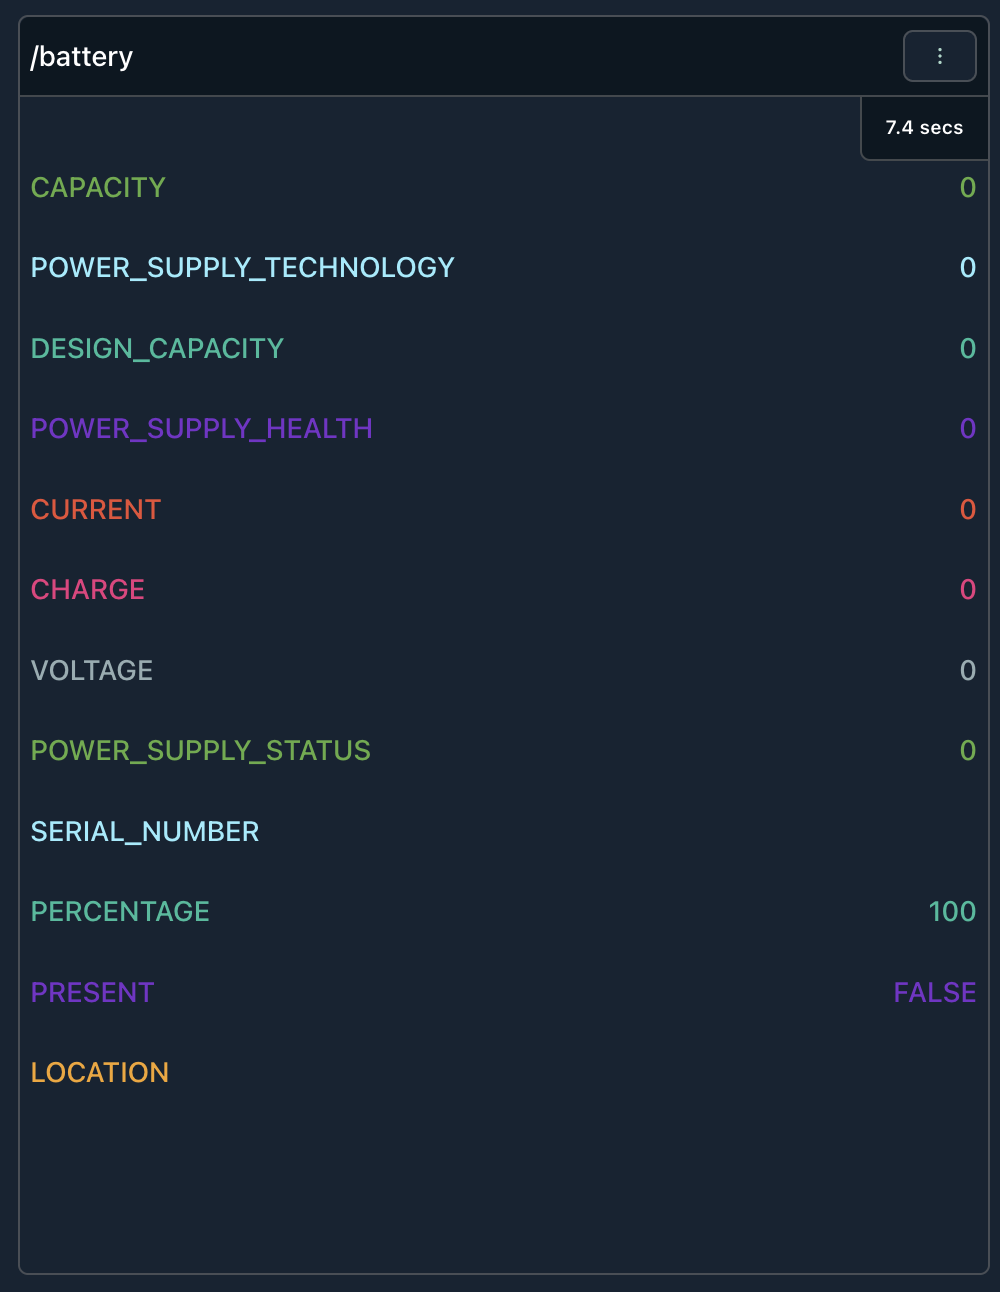
Topic cards in the dashboard view have various settings. We will walk through some example topics and demonstrate the available configurations available to them. For this example, let's look at a battery topic.
It shows us important information like the battery percentage, power supply health, and voltage.

This can become a little cluttered and we have the ability to show specific properties of the battery. This will help focus our ability to review the key device properties. By clicking the vertical ellipses in the top right of the card, we can open a form to configure this topic.
Currently, we are displaying the topic as a state visualization. We can edit the properties displayed, by clicking State Display Settings.
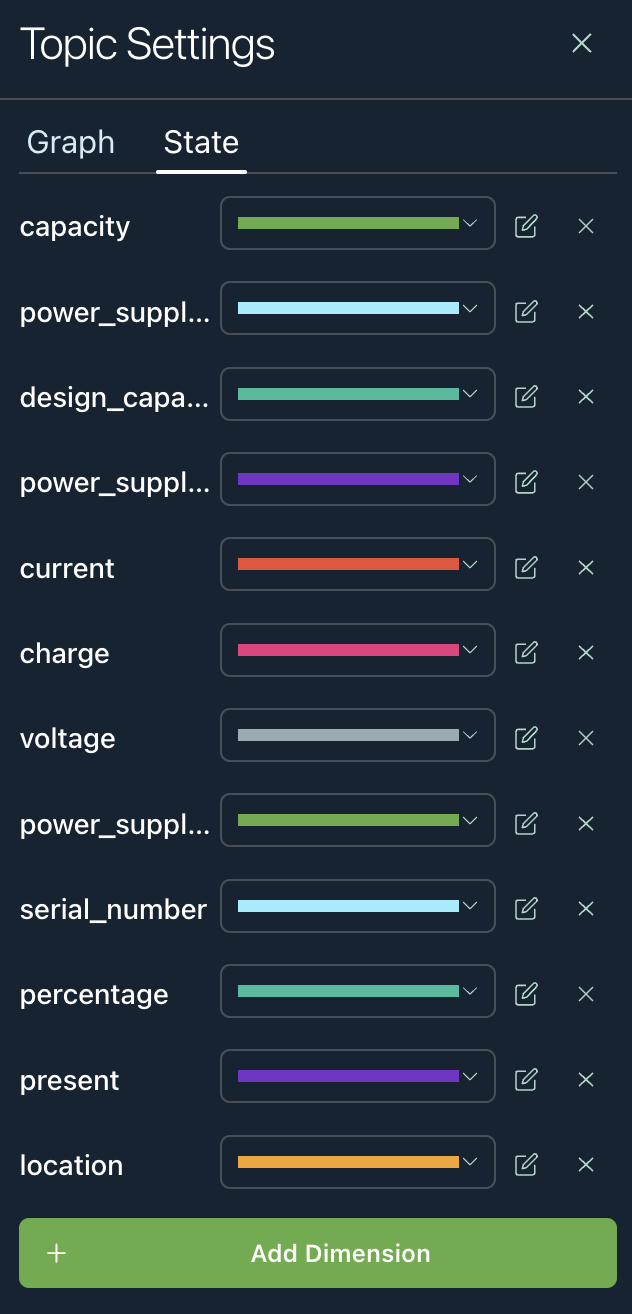
This will open a panel on the right side, that gives you the ability to add or remove properties to the display. You can change the color, edit the state variable, or delete it from this row.

State Views and Labels
When editing or adding dimensions, you will have to choose the path of the property, name, and/or label. For example, a user has targeted the power_supply_health property in this topic. It will have the name power supply health and will have a label of Not Charging if the value is < 7.
Graph Display Settings
You can navigate to the graph settings by clicking *Graph Display Settings*.
A side panel will open up from the right side. Within these graph topic settings, you have the ability to set properties to read from the left or right axis. By going into the settings of the left or right axis, you can configure the min and max range of that axis. In order to edit the dimensions, each dimension row has an individual setting that can be configured.
You can click the settings icon under the left or right axis headers. This will allow you to set the min and max limits of that Y-axis.
Individual configurations of a dimension will require the path to the value you want to monitor, the name/label you want to show to the end user, and a toggle that shows the data on the left or right axis.
Tips
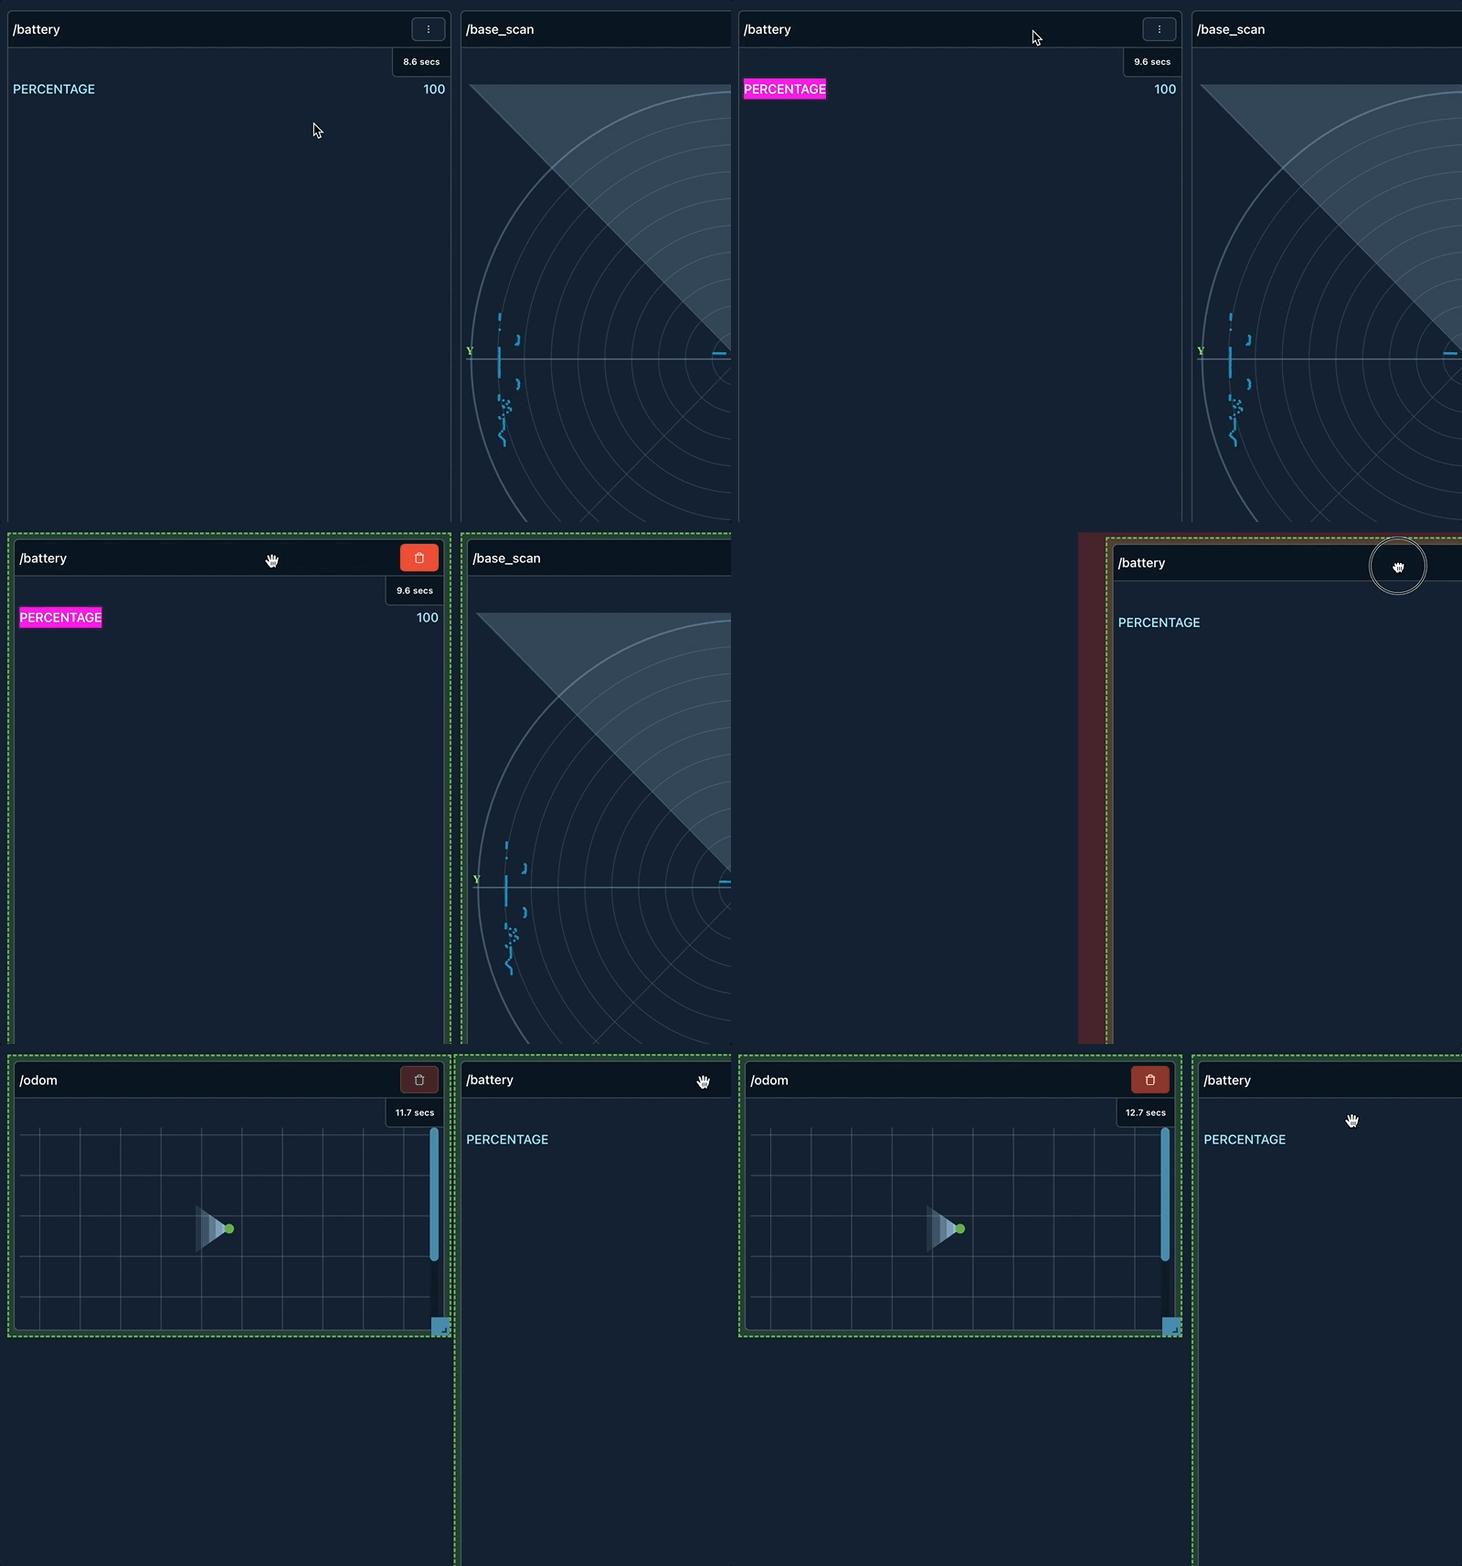
There are two ways to enter Edit Mode.
- Double-Click the Topic Card Header

- Click Edit Layout Mode in the top right corner of the page.

Updated over 3 years ago
